Product Design · Fintech
Financial Dashboards: Putting the data in clients’ hands
Self-serve dashboards that let university finance teams answer their own questions, plus a concept extension where an AI agent recommends collection-agency placements.
- Client adoption
- 100%Client adoption
- Fewer support tickets
- 38%Fewer support tickets
- Point increase in client NPS
- +32Point increase in client NPS
Context
ECSI, a Global Payments company, services student loans for universities. Its client platform served the administrators and financial officers who manage those loan portfolios.
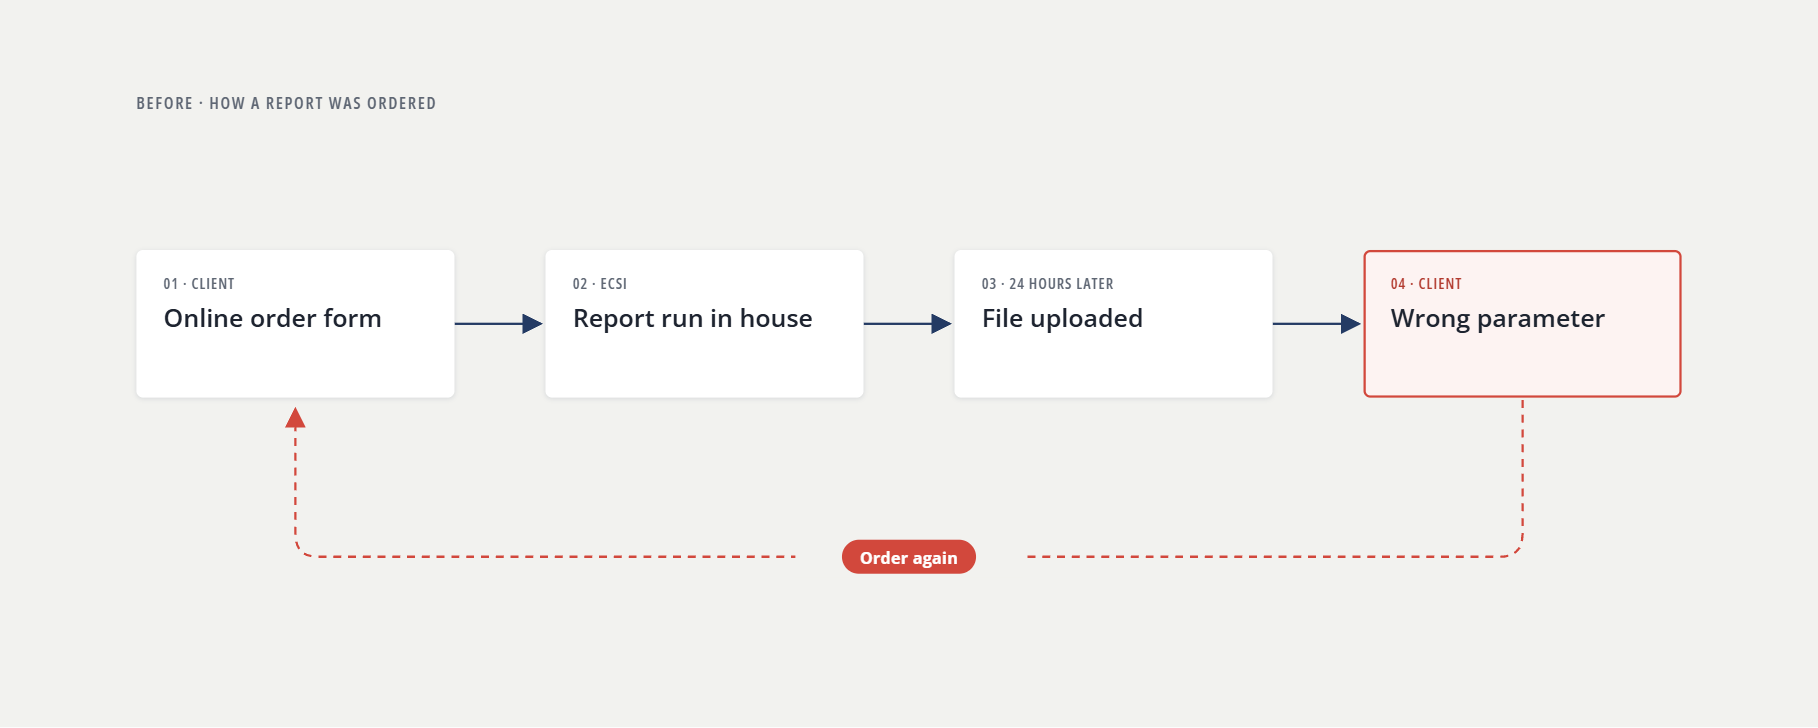
Every answer started with a form. A client ordered a report online, ECSI staff ran it in house, and the file arrived 24 hours later. A new question meant a new order and another day of waiting.
Orders peaked at the start and end of each semester, when clients needed answers fastest and ECSI staff had the least time to give.
A report answered only the question asked when it was ordered. Clients couldn’t:
- Change a date range or filter without ordering again
- Drill down from a total to the accounts behind it
- Look up a single account
In meetings, the reports came apart. Everyone brought their own printout, and the conversation scattered across different pages.
Meanwhile, competitors had started giving their clients dashboards. ECSI leadership made catching up a priority.
My role: Sole designer, from discovery through delivery. I led research, prototyping, and testing, working with a PM, two client advisors, a marketing director, and two developers. The client advisors were my line to what clients wanted. Their relationships opened doors I couldn’t have opened cold. Discovery to launch of the first dashboards took about six weeks.
The data was there. Clients couldn’t work with it, and they couldn’t see it together.
Objective
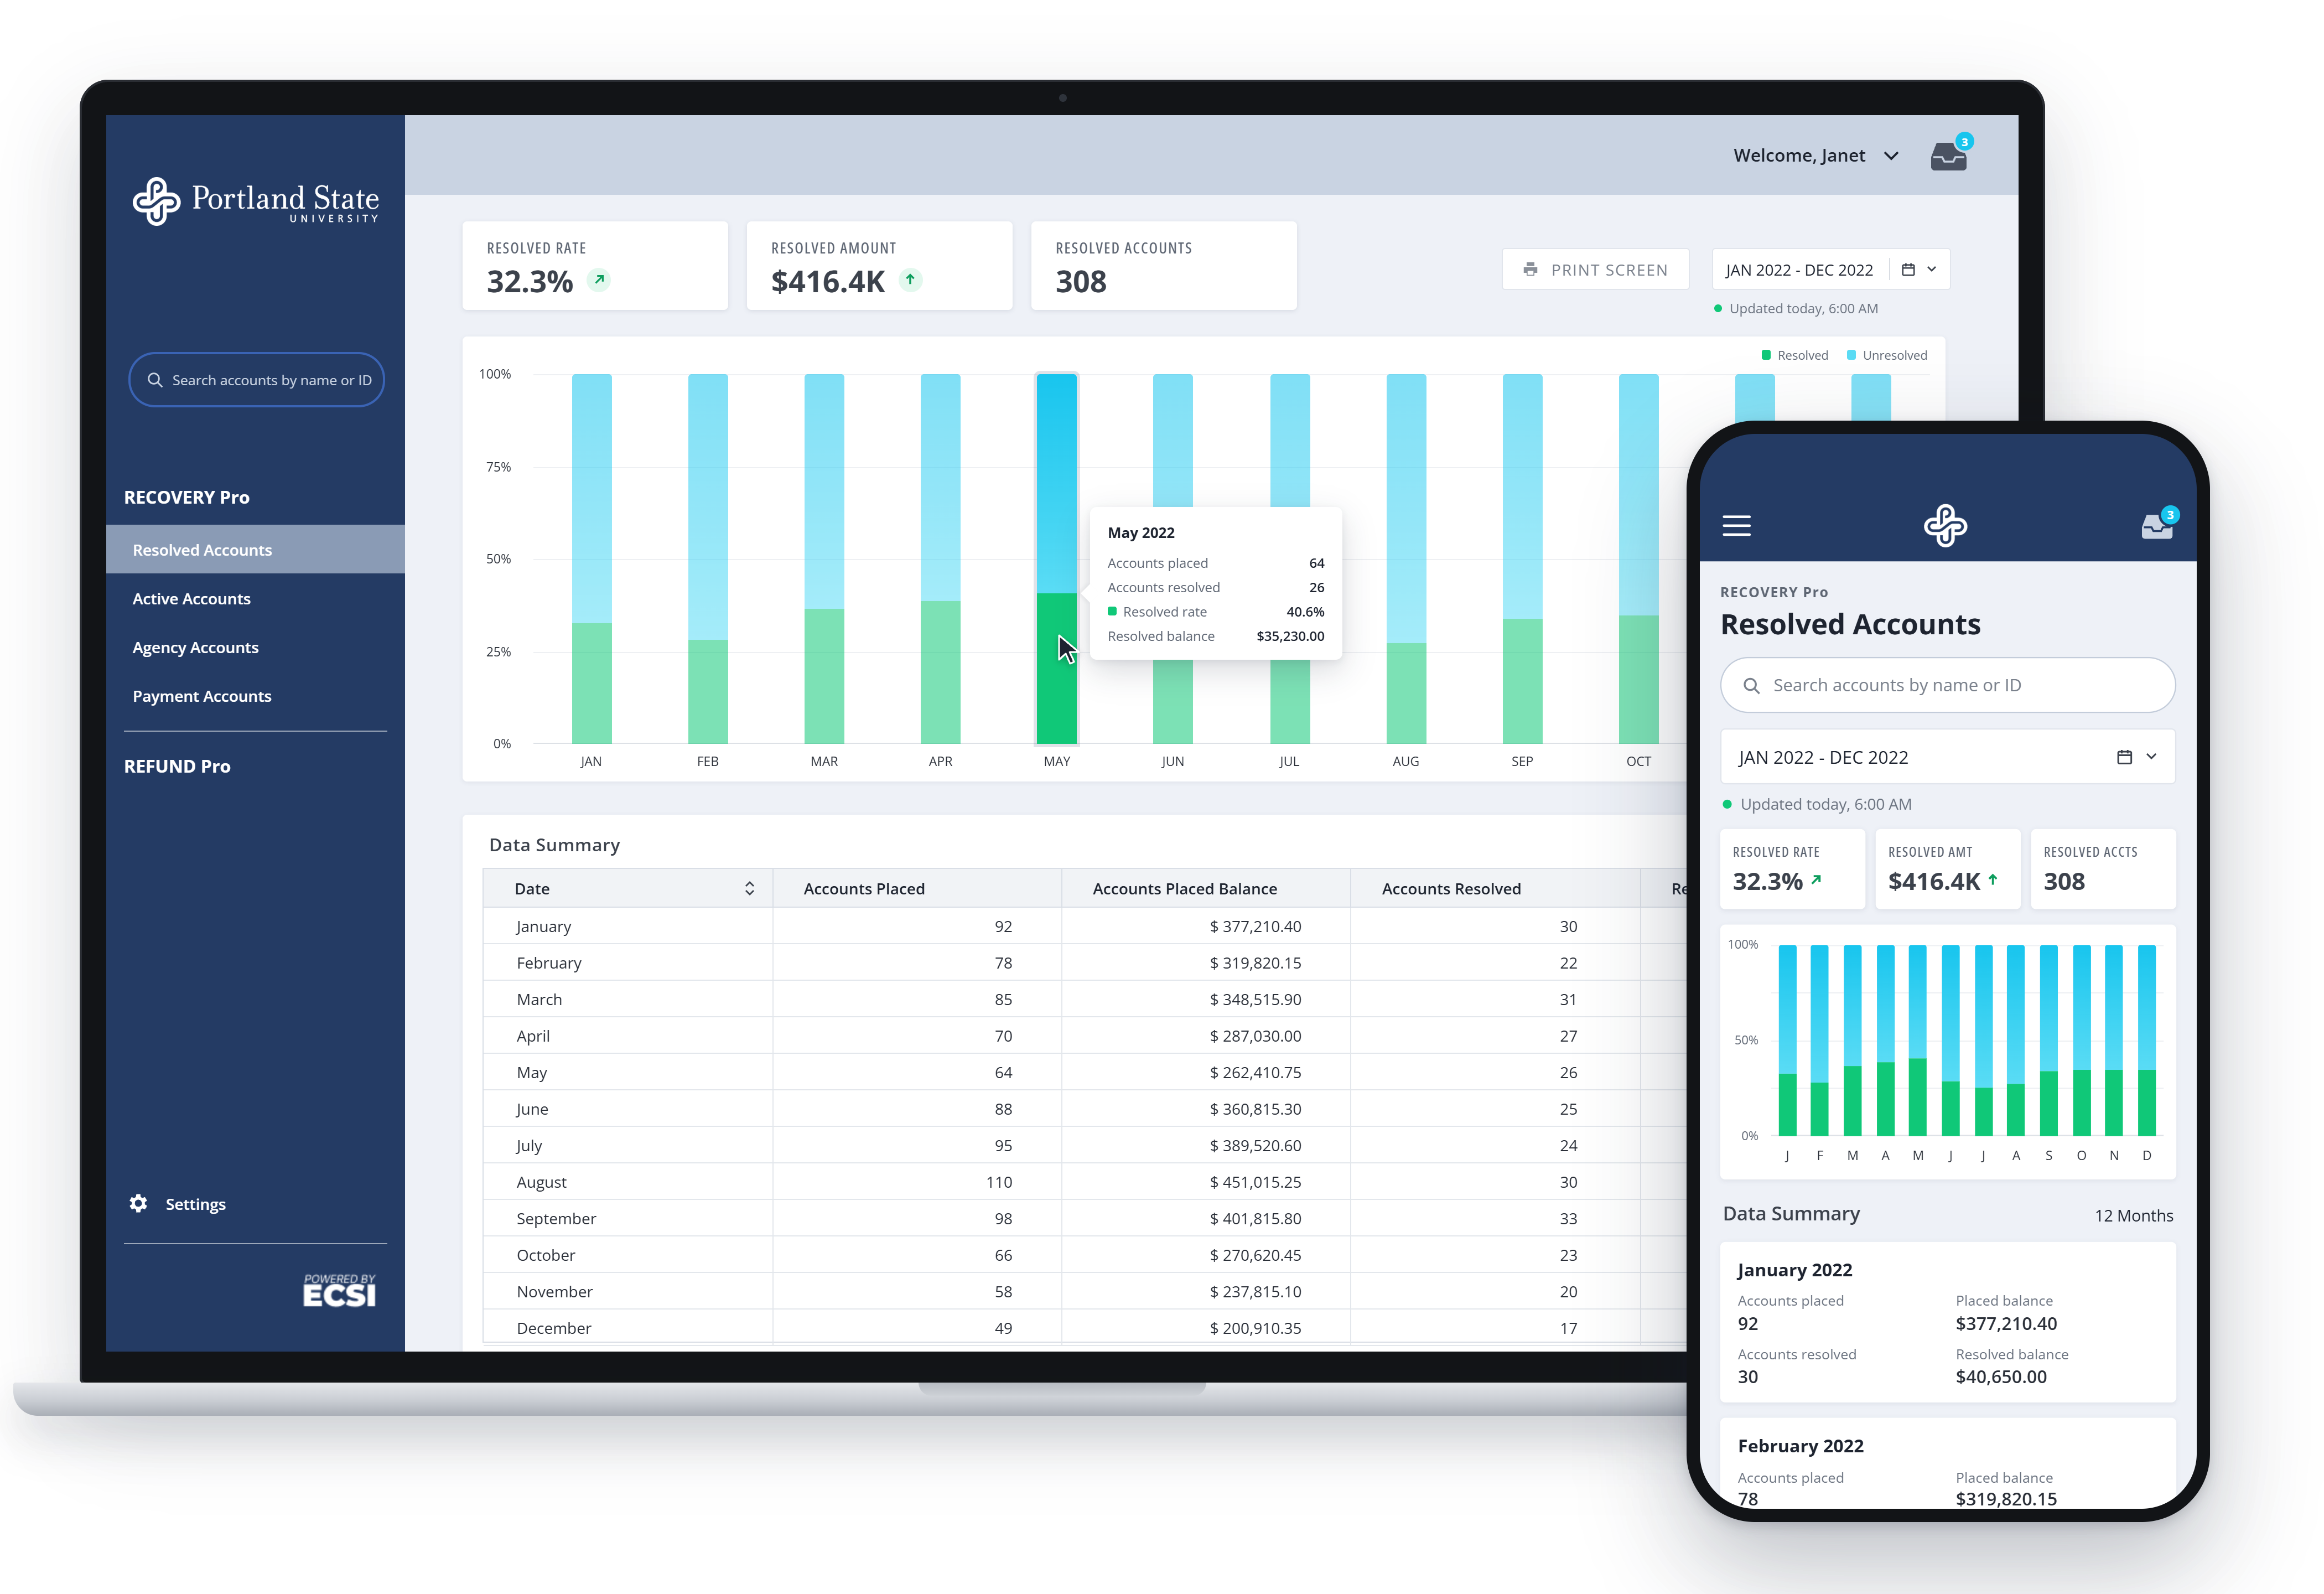
Put the data in clients’ hands. Dashboards refreshed overnight as accounts reconciled, so each morning clients could filter, drill down from totals to accounts, look up a single account, and put one shared view in front of the room.
Three constraints shaped every decision:
- A legacy data model, to design within, not around.
- A corporate rebrand that landed mid-project.
- Paper. Reports still circulated in print, so every dashboard had to print cleanly.
Approach
1. Start with what clients were already ordering
Discovery drew on report-order history, reprint requests, support tickets, client interviews, and the client advisors. The reprints told the clearest story: clients re-ordering a report because one parameter was wrong, then waiting another 24 hours for the fix.
2. Five reports carried most of the demand
Most orders came down to five reports. Each became a dashboard with one job. Everything else moved to self-serve ad hoc reports, off ECSI’s queue. Account lookup was a requirement from day one. Drill-down from totals to accounts followed in a later release.
The rule: one dashboard, one story. Each screen makes a single argument instead of crowding every metric onto the page.
3. One unified design system replaced outdated styles
On mobile, the platform loaded outdated styles. Tracing the problem turned up so many conflicting style sheets that none could be trusted. The answer was one system: a component library built in Axure, where interactions could be coded and tested before development. Developers built the components in Angular and documented them in Storybook, so design and code worked from the same source.
It paid off three ways. When the rebrand hit mid-project, it changed once, at the system level, not page by page. Every color and type combination was verified as accessible. And with design and code sharing components, QA bugs fell by about 25%.
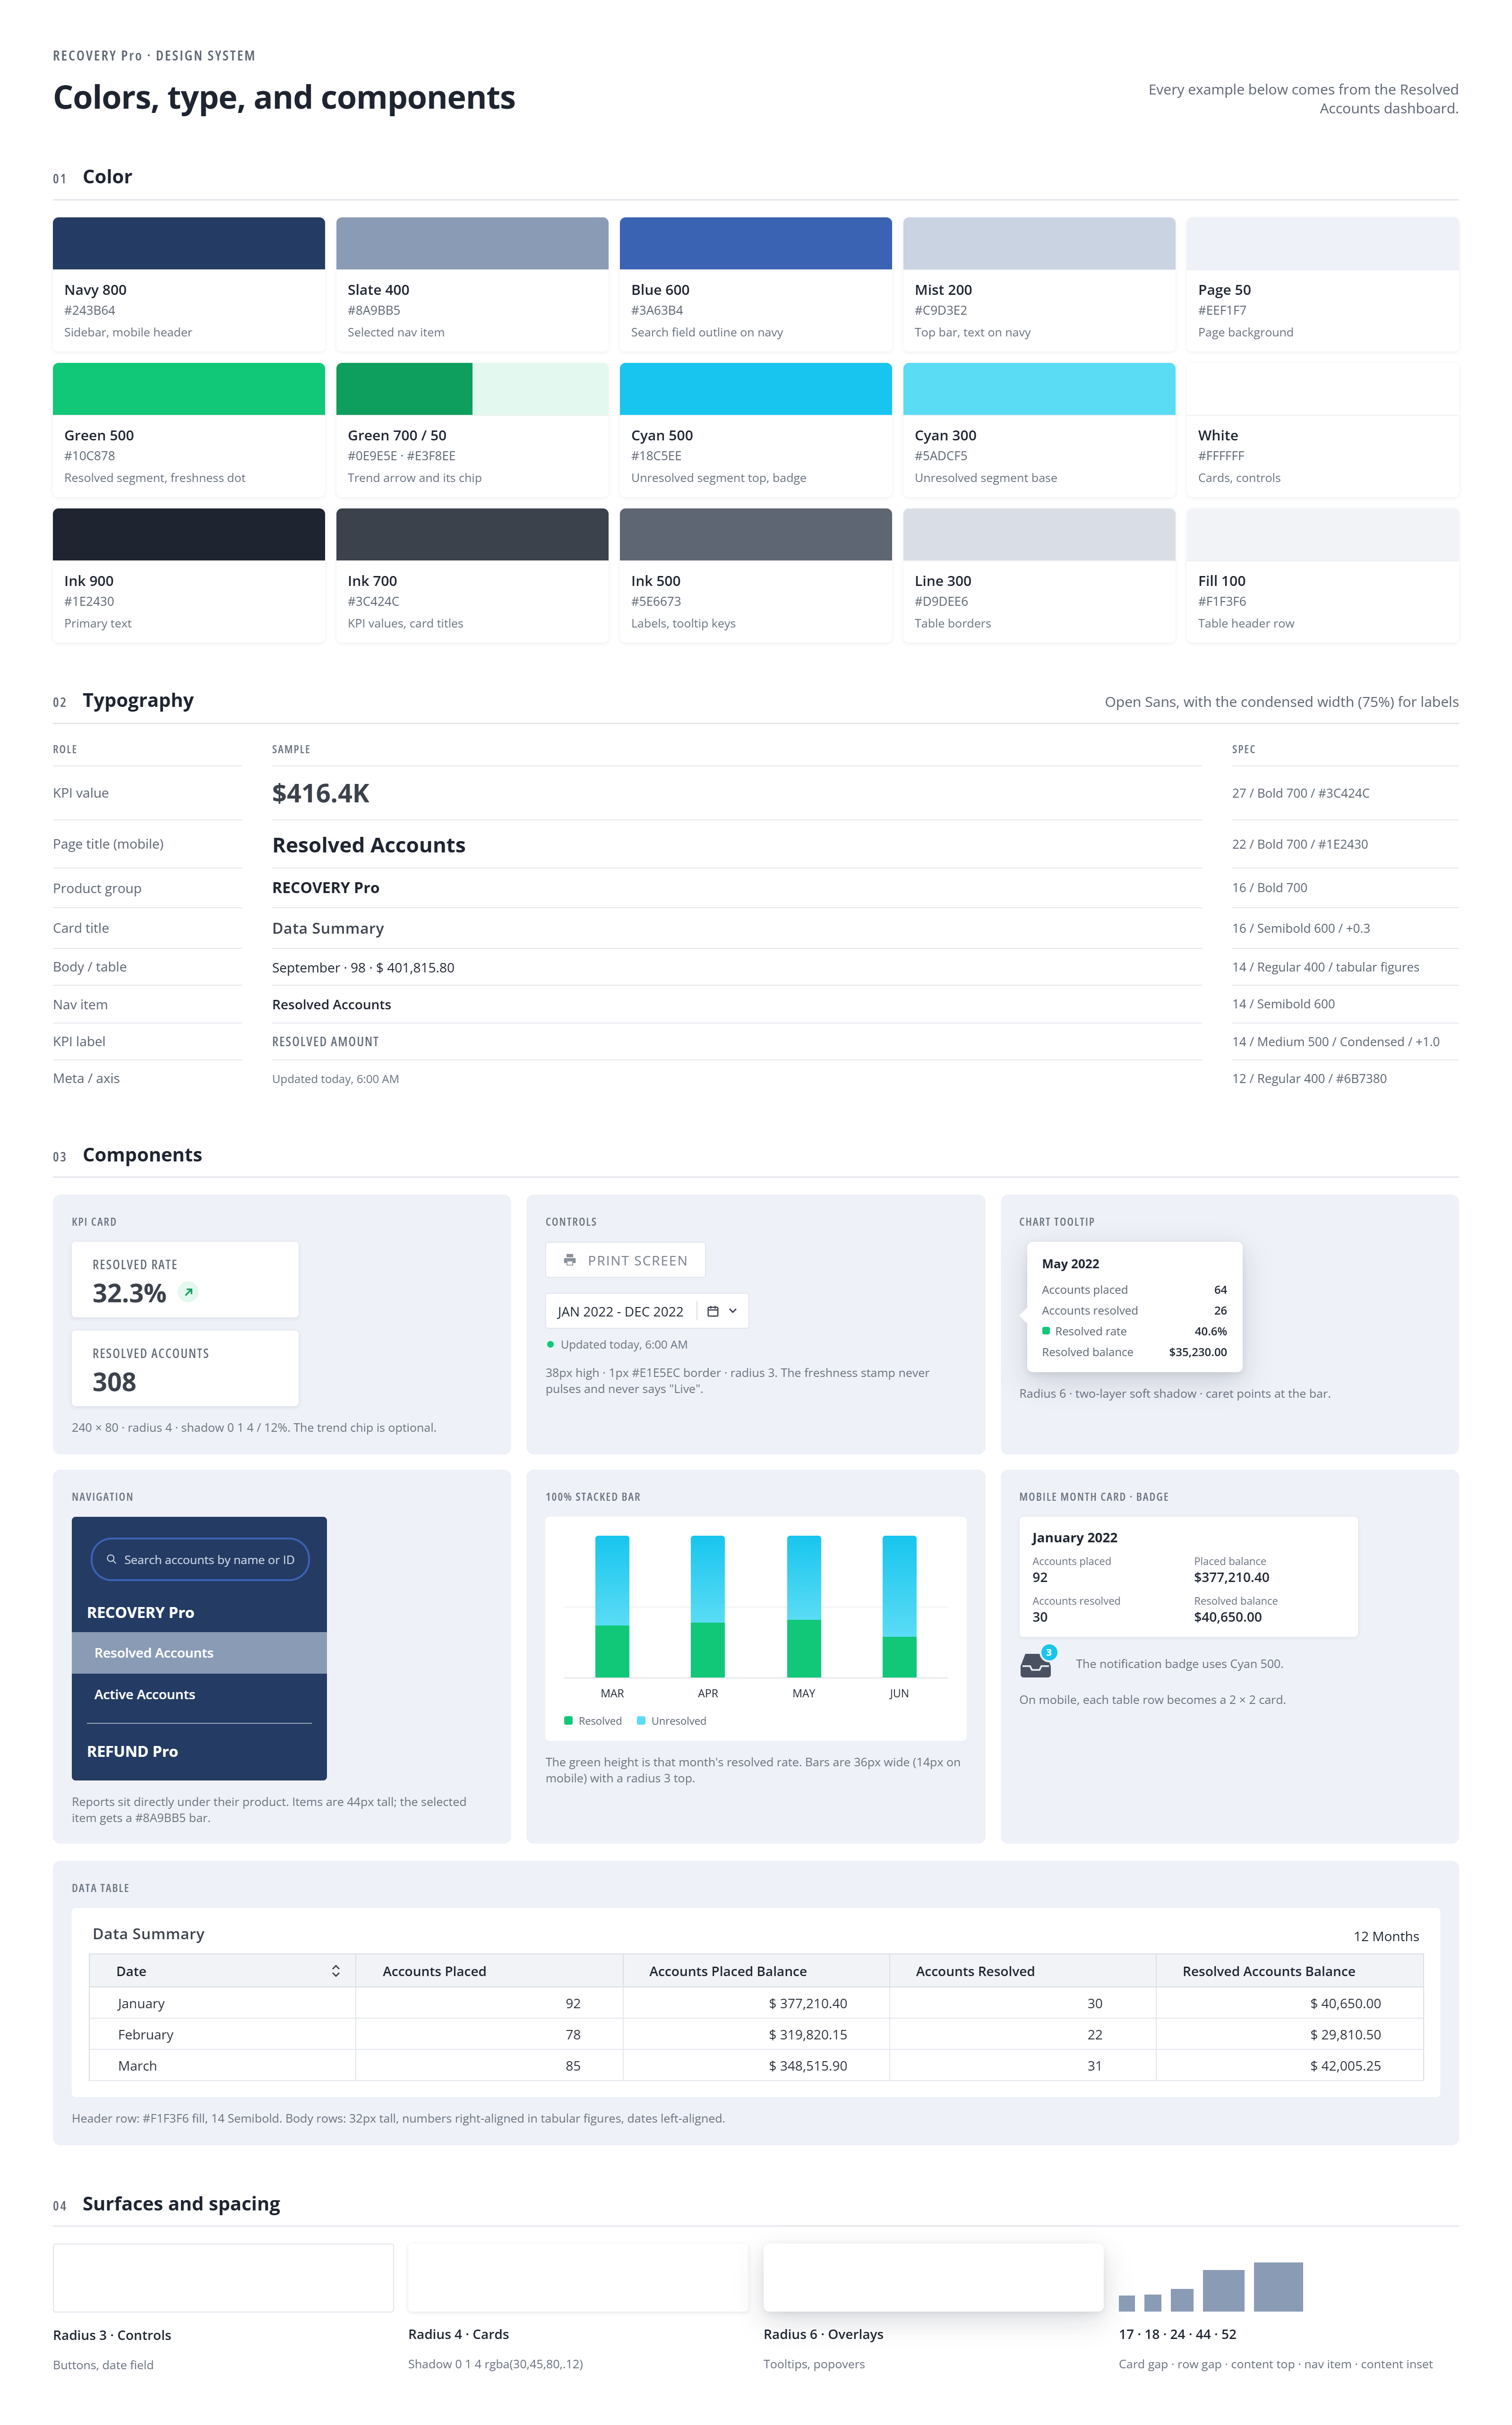 — open at full size
4. Testing changed two core patterns
Sessions included client staff, client leads, and ECSI internal staff. Two changes came straight out of them.
Navigation moved to the left column. The first build ran the five report areas as tabs across the top. Eye-tracking showed users weren’t finding them. They went looking for navigation somewhere else entirely. The problem was the mental model, not the labels. Retesting found where users expected it: in the left column, directly under the product name. That’s where it went.
A calendar replaced the slider. The date-range slider came from a licensed data-visualization library, in use mainly because ECSI had already paid for it. Dragging to a date was slow and imprecise, and no one expected it. A standard calendar picker took its place.
5. From reporting on collections to predictive placements
When an account goes to collections, the university chooses the agency, working from its own short list.
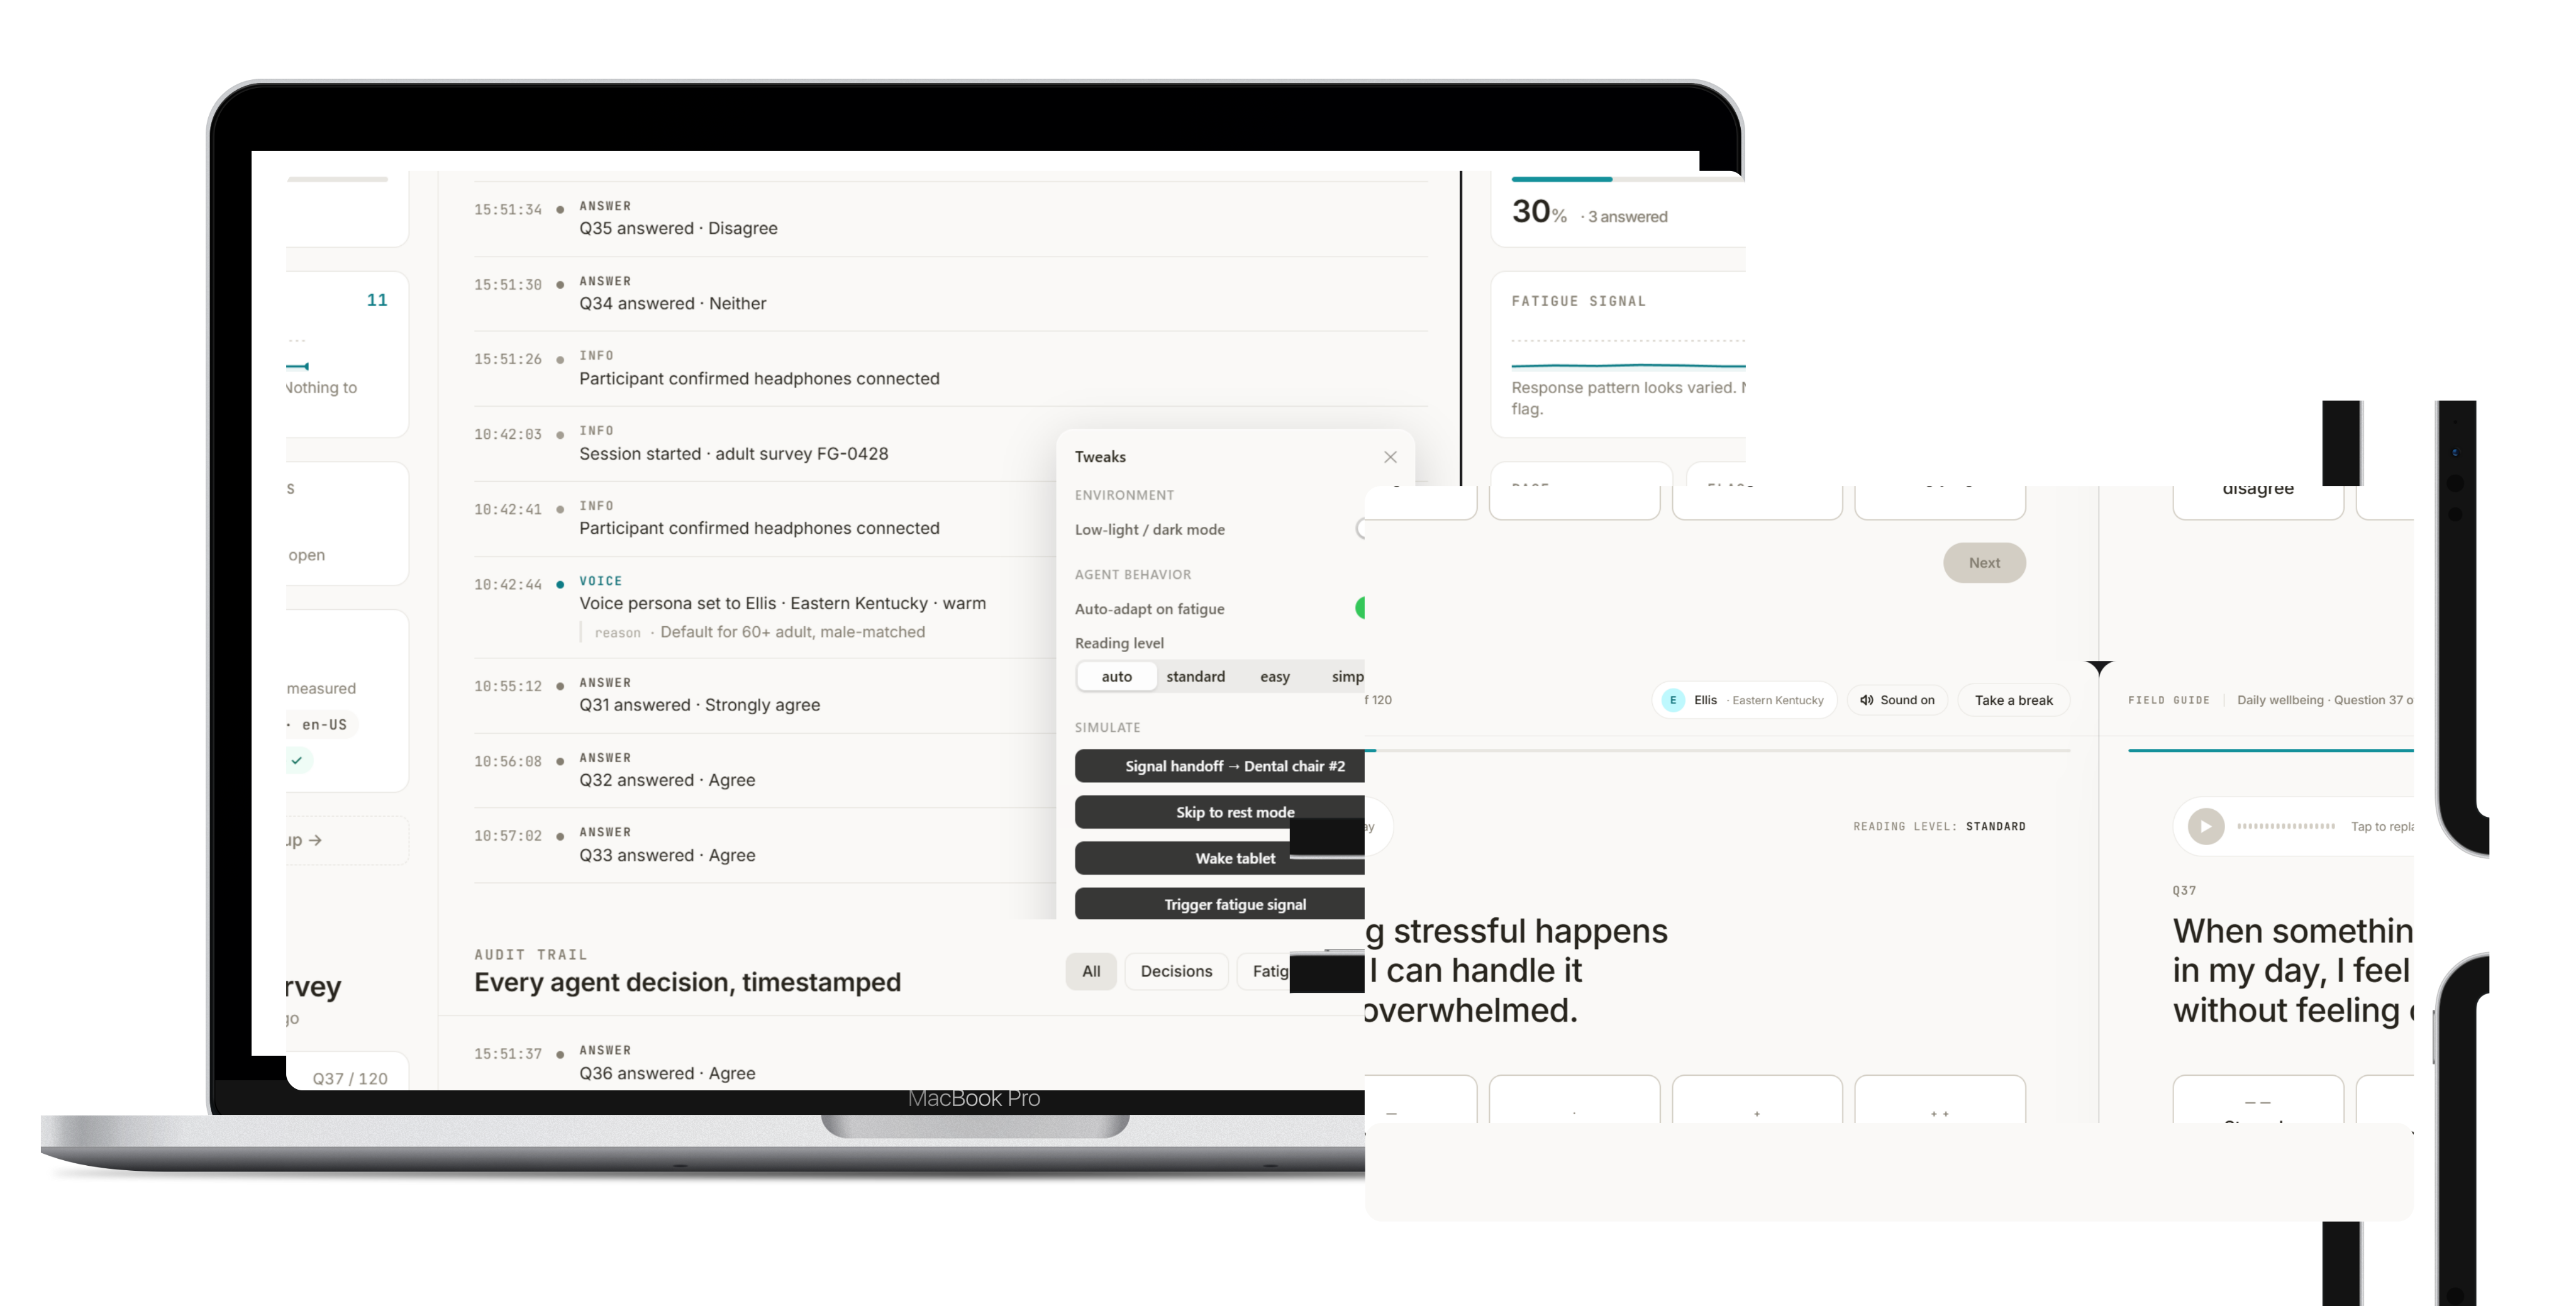
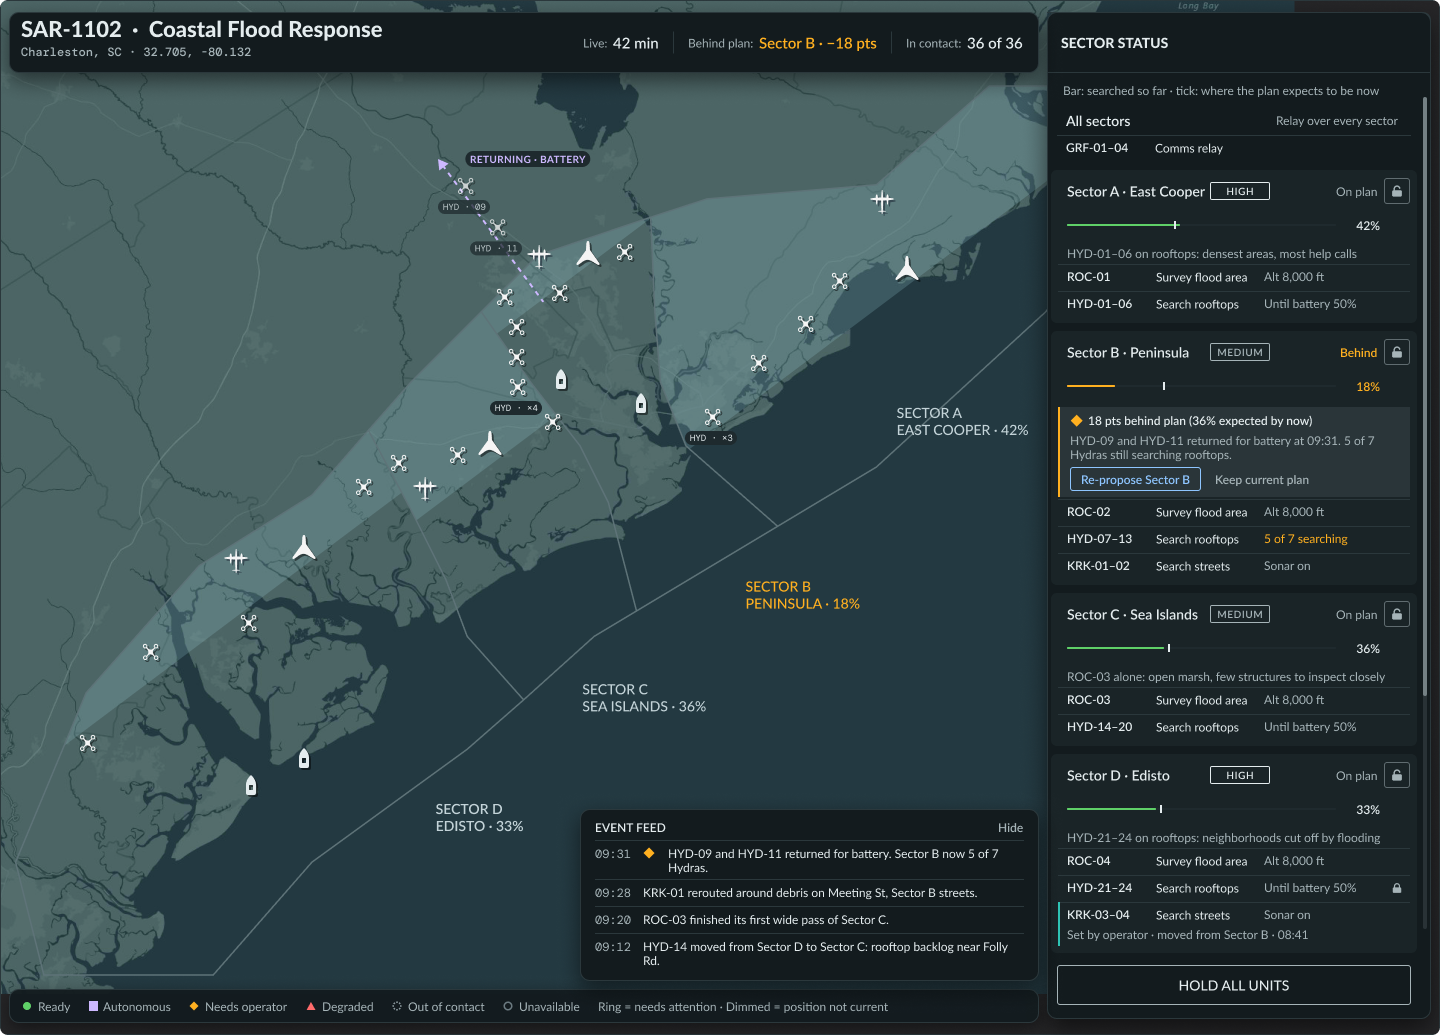
At ECSI, agency performance shipped as reporting on amounts collected. The concept extension is a placement agent. It gathers data on each of the university’s selected agencies, reviews the borrower’s history and balance, and ranks the agencies on compliance, data security, and collection performance.
Every recommendation carries a confidence score and a rationale. A person at the university approves it or overrides it. When confidence is low, the agent doesn’t guess. It marks the account Needs human review.
A concept, built on synthetic data modeled on ECSI’s reporting.
Key decisions and trade-offs
| Decision | Why | Result |
|---|---|---|
| Self-serve dashboards over ordered reports | Every question cost a form and a 24-hour wait | Report orders stopped |
| Five dashboards, everything else ad hoc | Five reports carried most of the demand | Clients ran one-off reports themselves |
| Navigation in the left column, under the product name | Eye-tracking showed users missed the top tabs | Retesting confirmed it was where users looked |
| Calendar picker over the licensed slider | The slider was slow, imprecise, and unfamiliar | Easier to use; a pattern users already knew |
| One design system, built in Axure | Conflicting style sheets broke the mobile view | Rebrand applied once; accessible color and type; about 25% fewer QA bugs |
Outcomes & Impact
- Client adoption
- 100%Client adoption
- Fewer support tickets
- 38%Fewer support tickets
- Point increase in client NPS
- +32Point increase in client NPS
For ECSI
- Staff time back. About 20 staff hours a month no longer went to running and uploading reports by hand, including during the semester rushes when staff were stretched thinnest.
- Support tickets down 38%. With answers in the dashboards, clients needed support less often for reports and report fixes.
- A feature sales could show. The dashboards became a centerpiece of sales demos in new-client conversations.
- Less time spent on fixes. The design system absorbed a mid-project rebrand and cut QA bugs by about 25%.
For clients
- Every client on board. All client institutions adopted the dashboards.
- No more waiting. Data refreshed overnight replaced the 24-hour order cycle.
- One view in the room. Clients projected the dashboards in presentations instead of passing around printouts.
- Higher satisfaction. Client NPS rose 32 points, from 42 to 74.
Reflection
Fewer patterns, faster adoption
A few familiar patterns got users working sooner than a richer toolkit would have. Swapping the licensed slider for a standard calendar picker is the clearest example.