Intelligent systems
meet human design.

I translate what complex systems are doing into language people can read, trust, and act on.

Selected case studies

All work →

AI Rebuild · Health Research

Field Guide: Transforming data collection in rural Appalachia

An NIH-funded Pitt–WVU health study. The original redesign and its results, now rebuilt with AI.

Read the case study
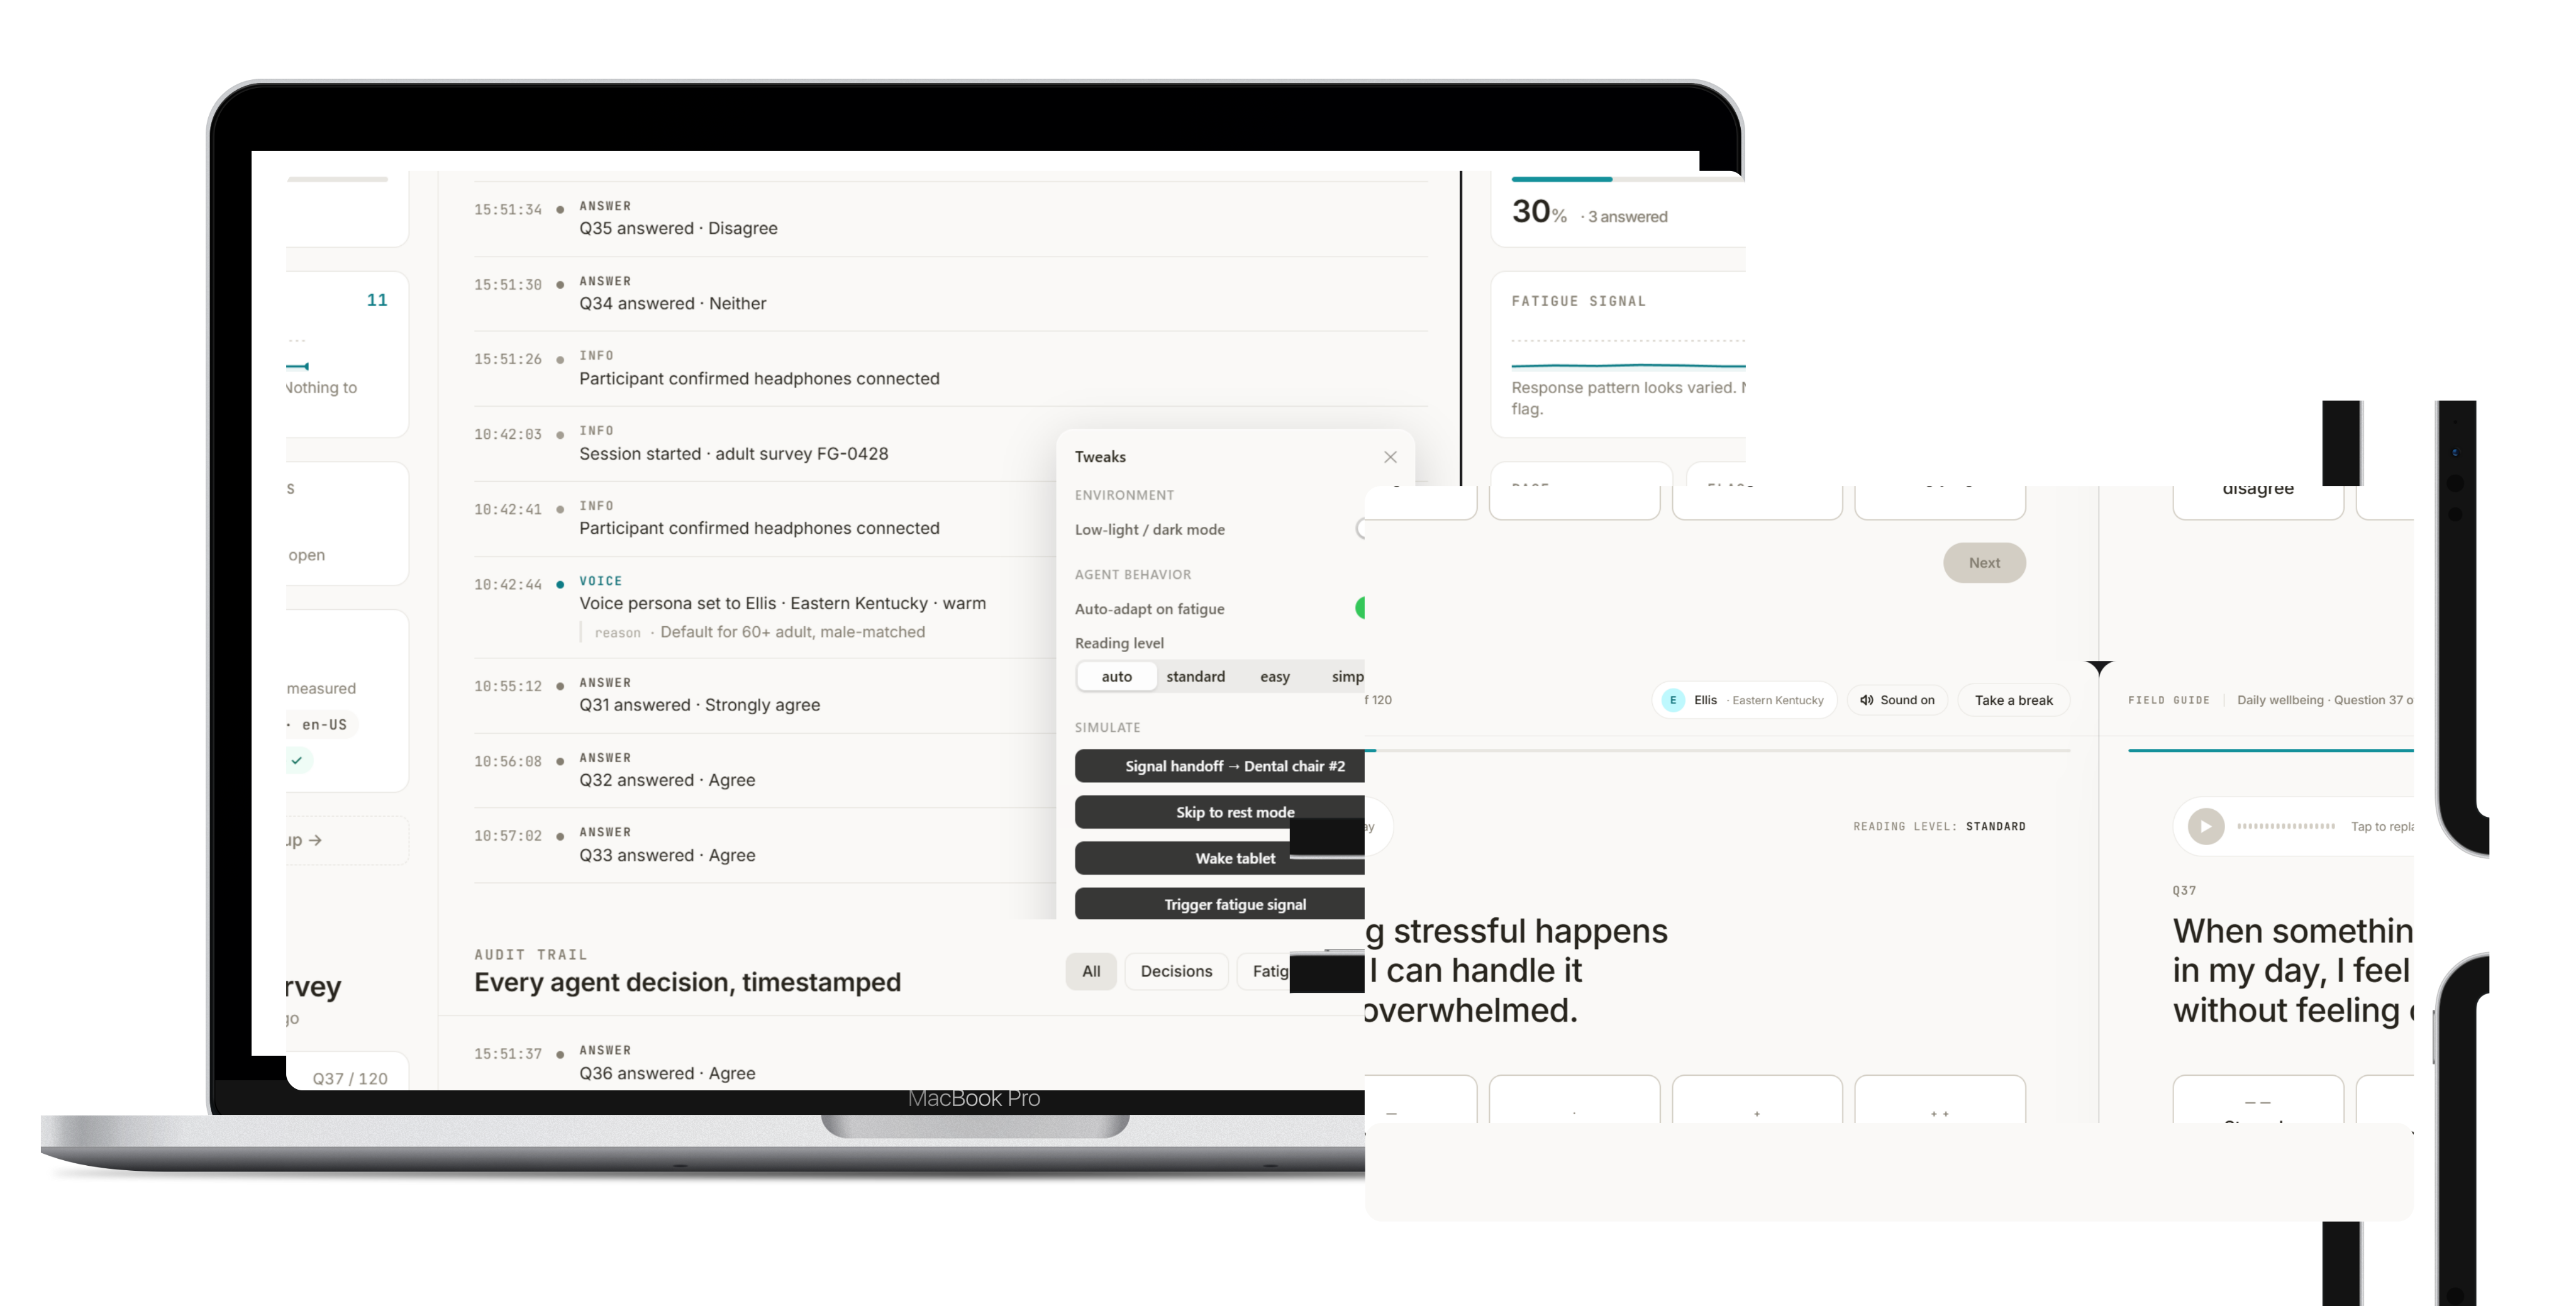
A laptop and a tablet side by side. The laptop shows the researcher view of one session: progress at question 37 of 120, a fatigue signal reading “response pattern looks varied, nothing to flag”, an average pace of 4.1 seconds per answer, no open flags, the active voice persona and reading level, and a timestamped audit trail of every agent decision. The tablet shows what the participant sees: question 37 in large plain language, an audio control to replay it, and five response buttons from strongly disagree to strongly agree.

Design challenge · Physical AI

36 autonomous assets.One operator.No surprises after launch.

A search-and-rescue tasking console where the autonomy proposes, the operator decides, and every coverage gap is visible up front.

Read the case study
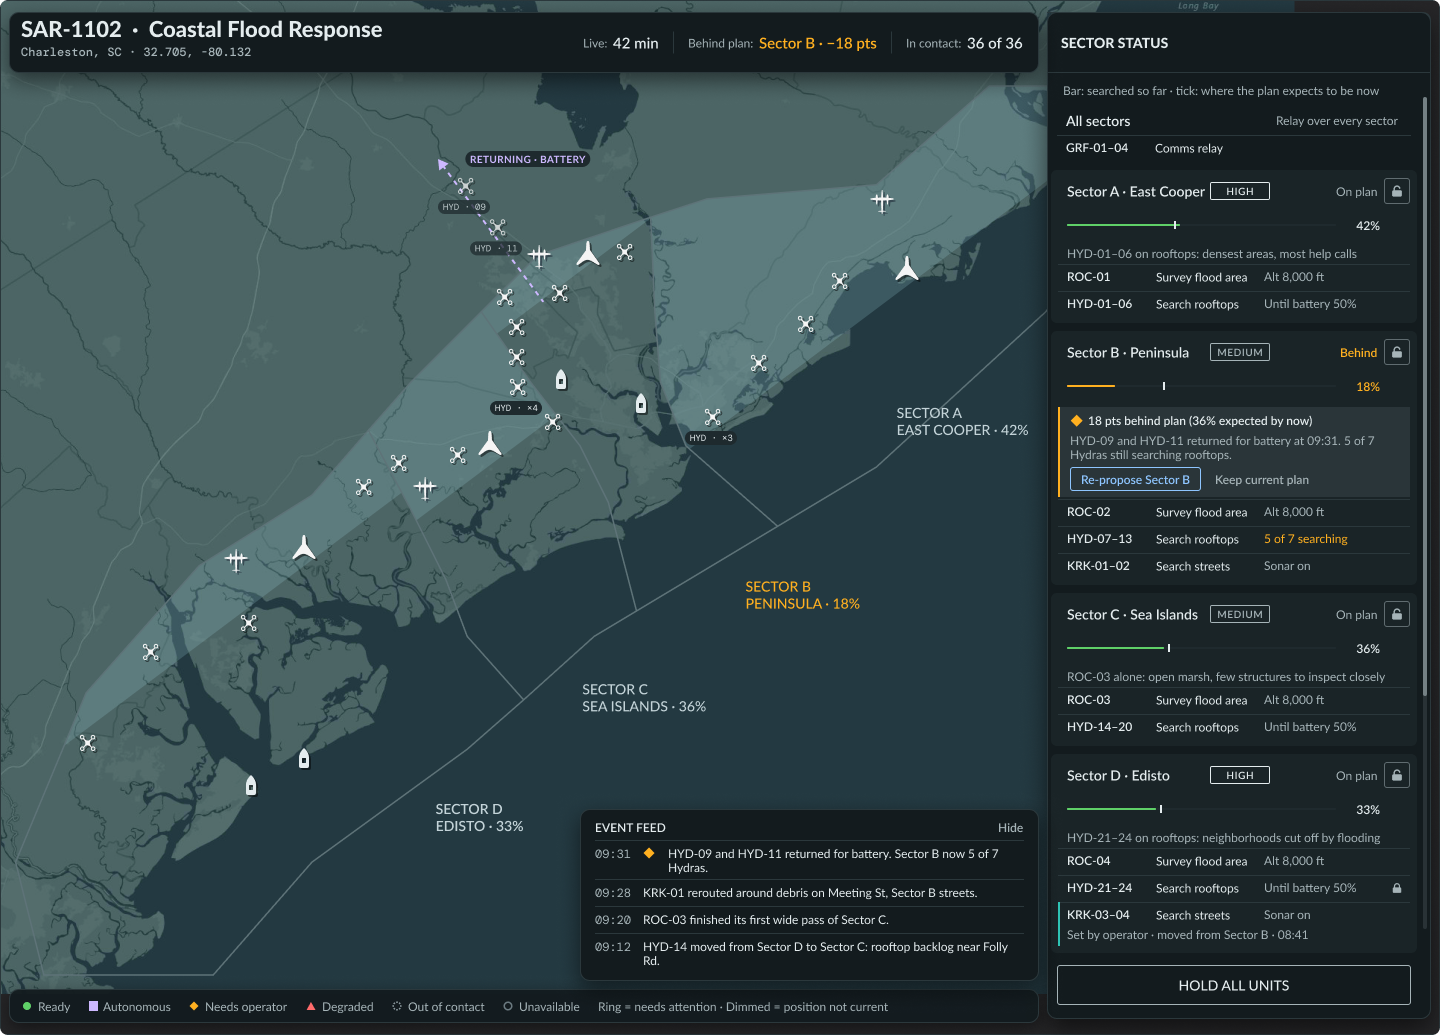
Screen 3, Tasking live: a mission console headed SAR-1102, Coastal Flood Response, at Charleston, South Carolina. A map of the flooded coastline is divided into four sectors — A East Cooper at 42%, B Peninsula at 18%, C Sea Islands at 36% and D Edisto at 33% — with individual asset markers across it, a few collapsed into groups such as HYD ×4, and one tagged RETURNING · BATTERY. The header reads Live 42 min, Behind plan Sector B −18 pts, and In contact 36 of 36. A Sector Status rail down the right states its own key — bar: searched so far, tick: where the plan expects to be now — then gives each sector a priority chip, a coverage bar with that tick, and its tasking rows. Sectors A, C and D read On plan; Sector B carries a warning reading 18 pts behind plan (36% expected by now), HYD-09 and HYD-11 returned for battery at 09:31, 5 of 7 Hydras still searching rooftops, offering Re-propose Sector B or Keep current plan. An event feed logs timestamped changes from 09:12 to 09:31, a legend names the six asset states and adds that a ring means needs attention and dimming means the position is not current, and a Hold all units button sits at the foot of the rail.

Product Design · Fintech

Financial Dashboards: Putting the data in clients’ hands

Self-serve financial dashboards for university finance teams. Report orders stopped and client NPS rose from 42 to 74. Agency placement, now rebuilt with AI.

Read the case study
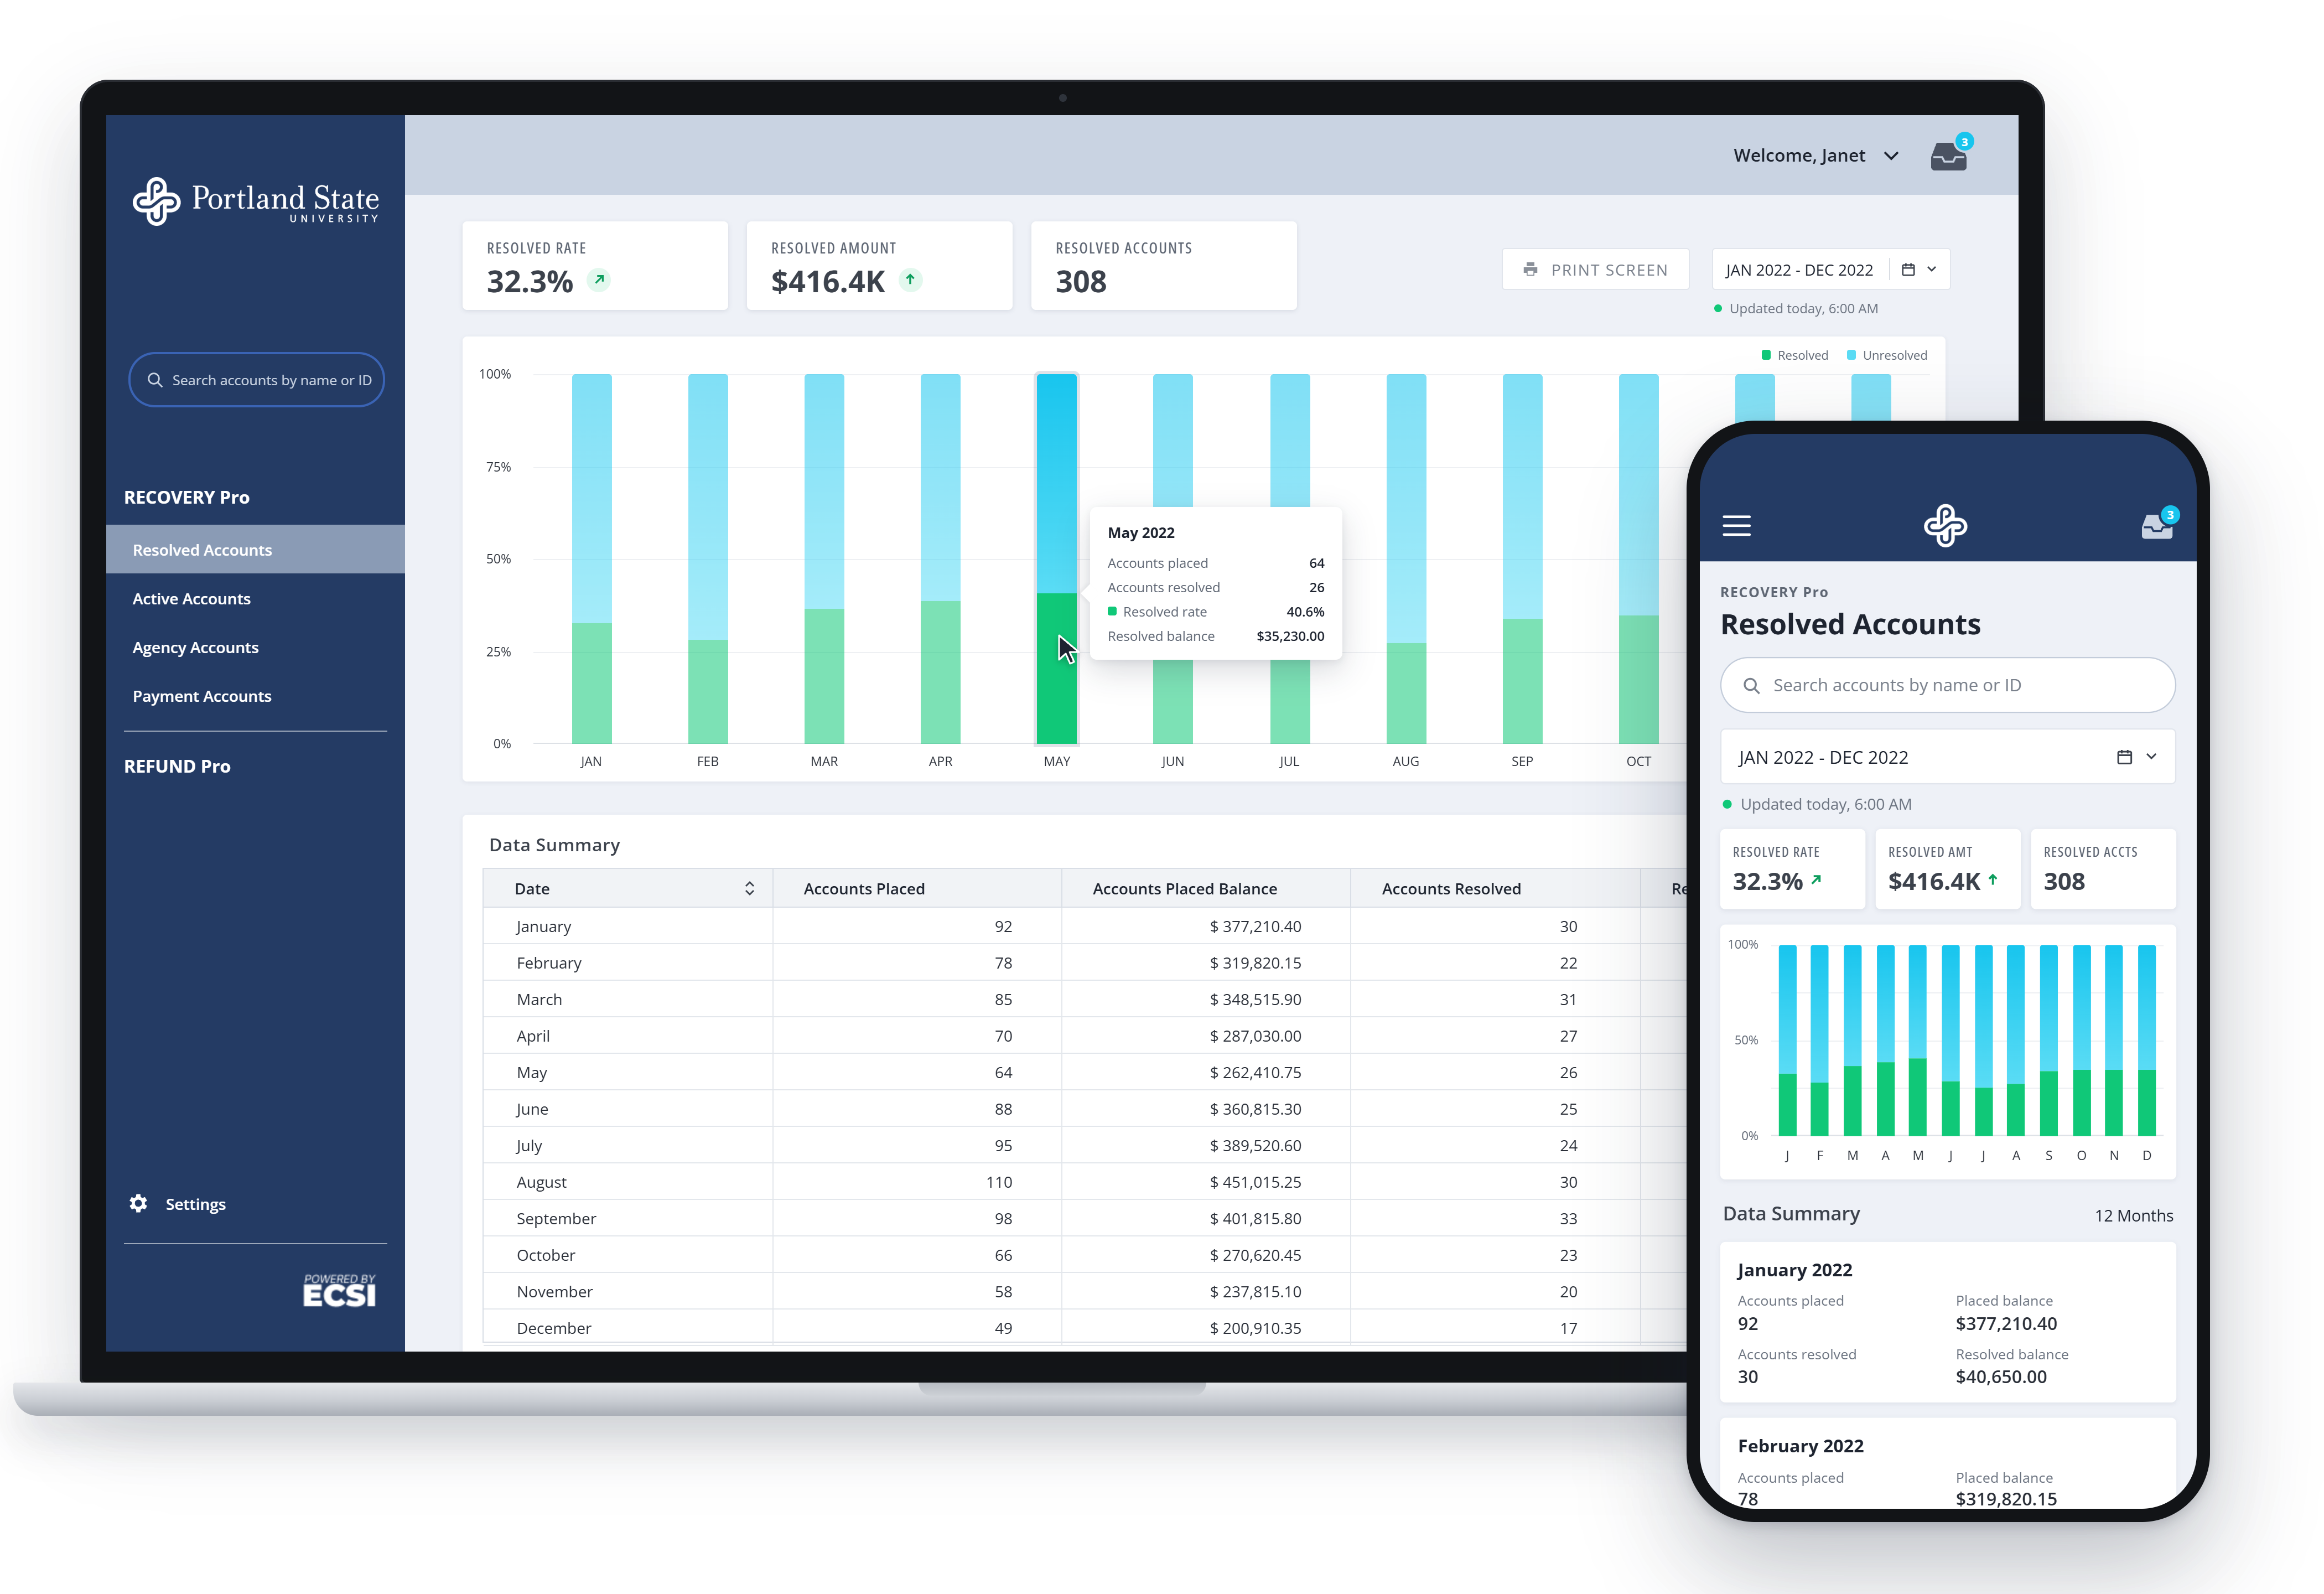
A desktop dashboard and a phone side by side, both showing the portal’s Resolved Accounts view for Portland State University. The desktop view has three summary tiles — a 32.3% resolved rate, $416.4K resolved amount and 308 resolved accounts — above a twelve-month stacked bar chart, with a tooltip on May 2022 reading 64 accounts placed, 26 resolved, a 40.6% resolved rate and a $35,230.00 resolved balance, and a Data Summary table of monthly placements below. The phone shows the same view stacked: date range, the three tiles, the chart, then the first months of the summary as cards. The sidebar lists Resolved, Active, Agency and Payment Accounts under RECOVERY Pro, with REFUND Pro beneath.