AI Rebuild · Health Research
Field Guide: Transforming data collection in rural Appalachia
An NIH-funded Pitt–WVU health study. The original redesign and its results, now rebuilt with AI.




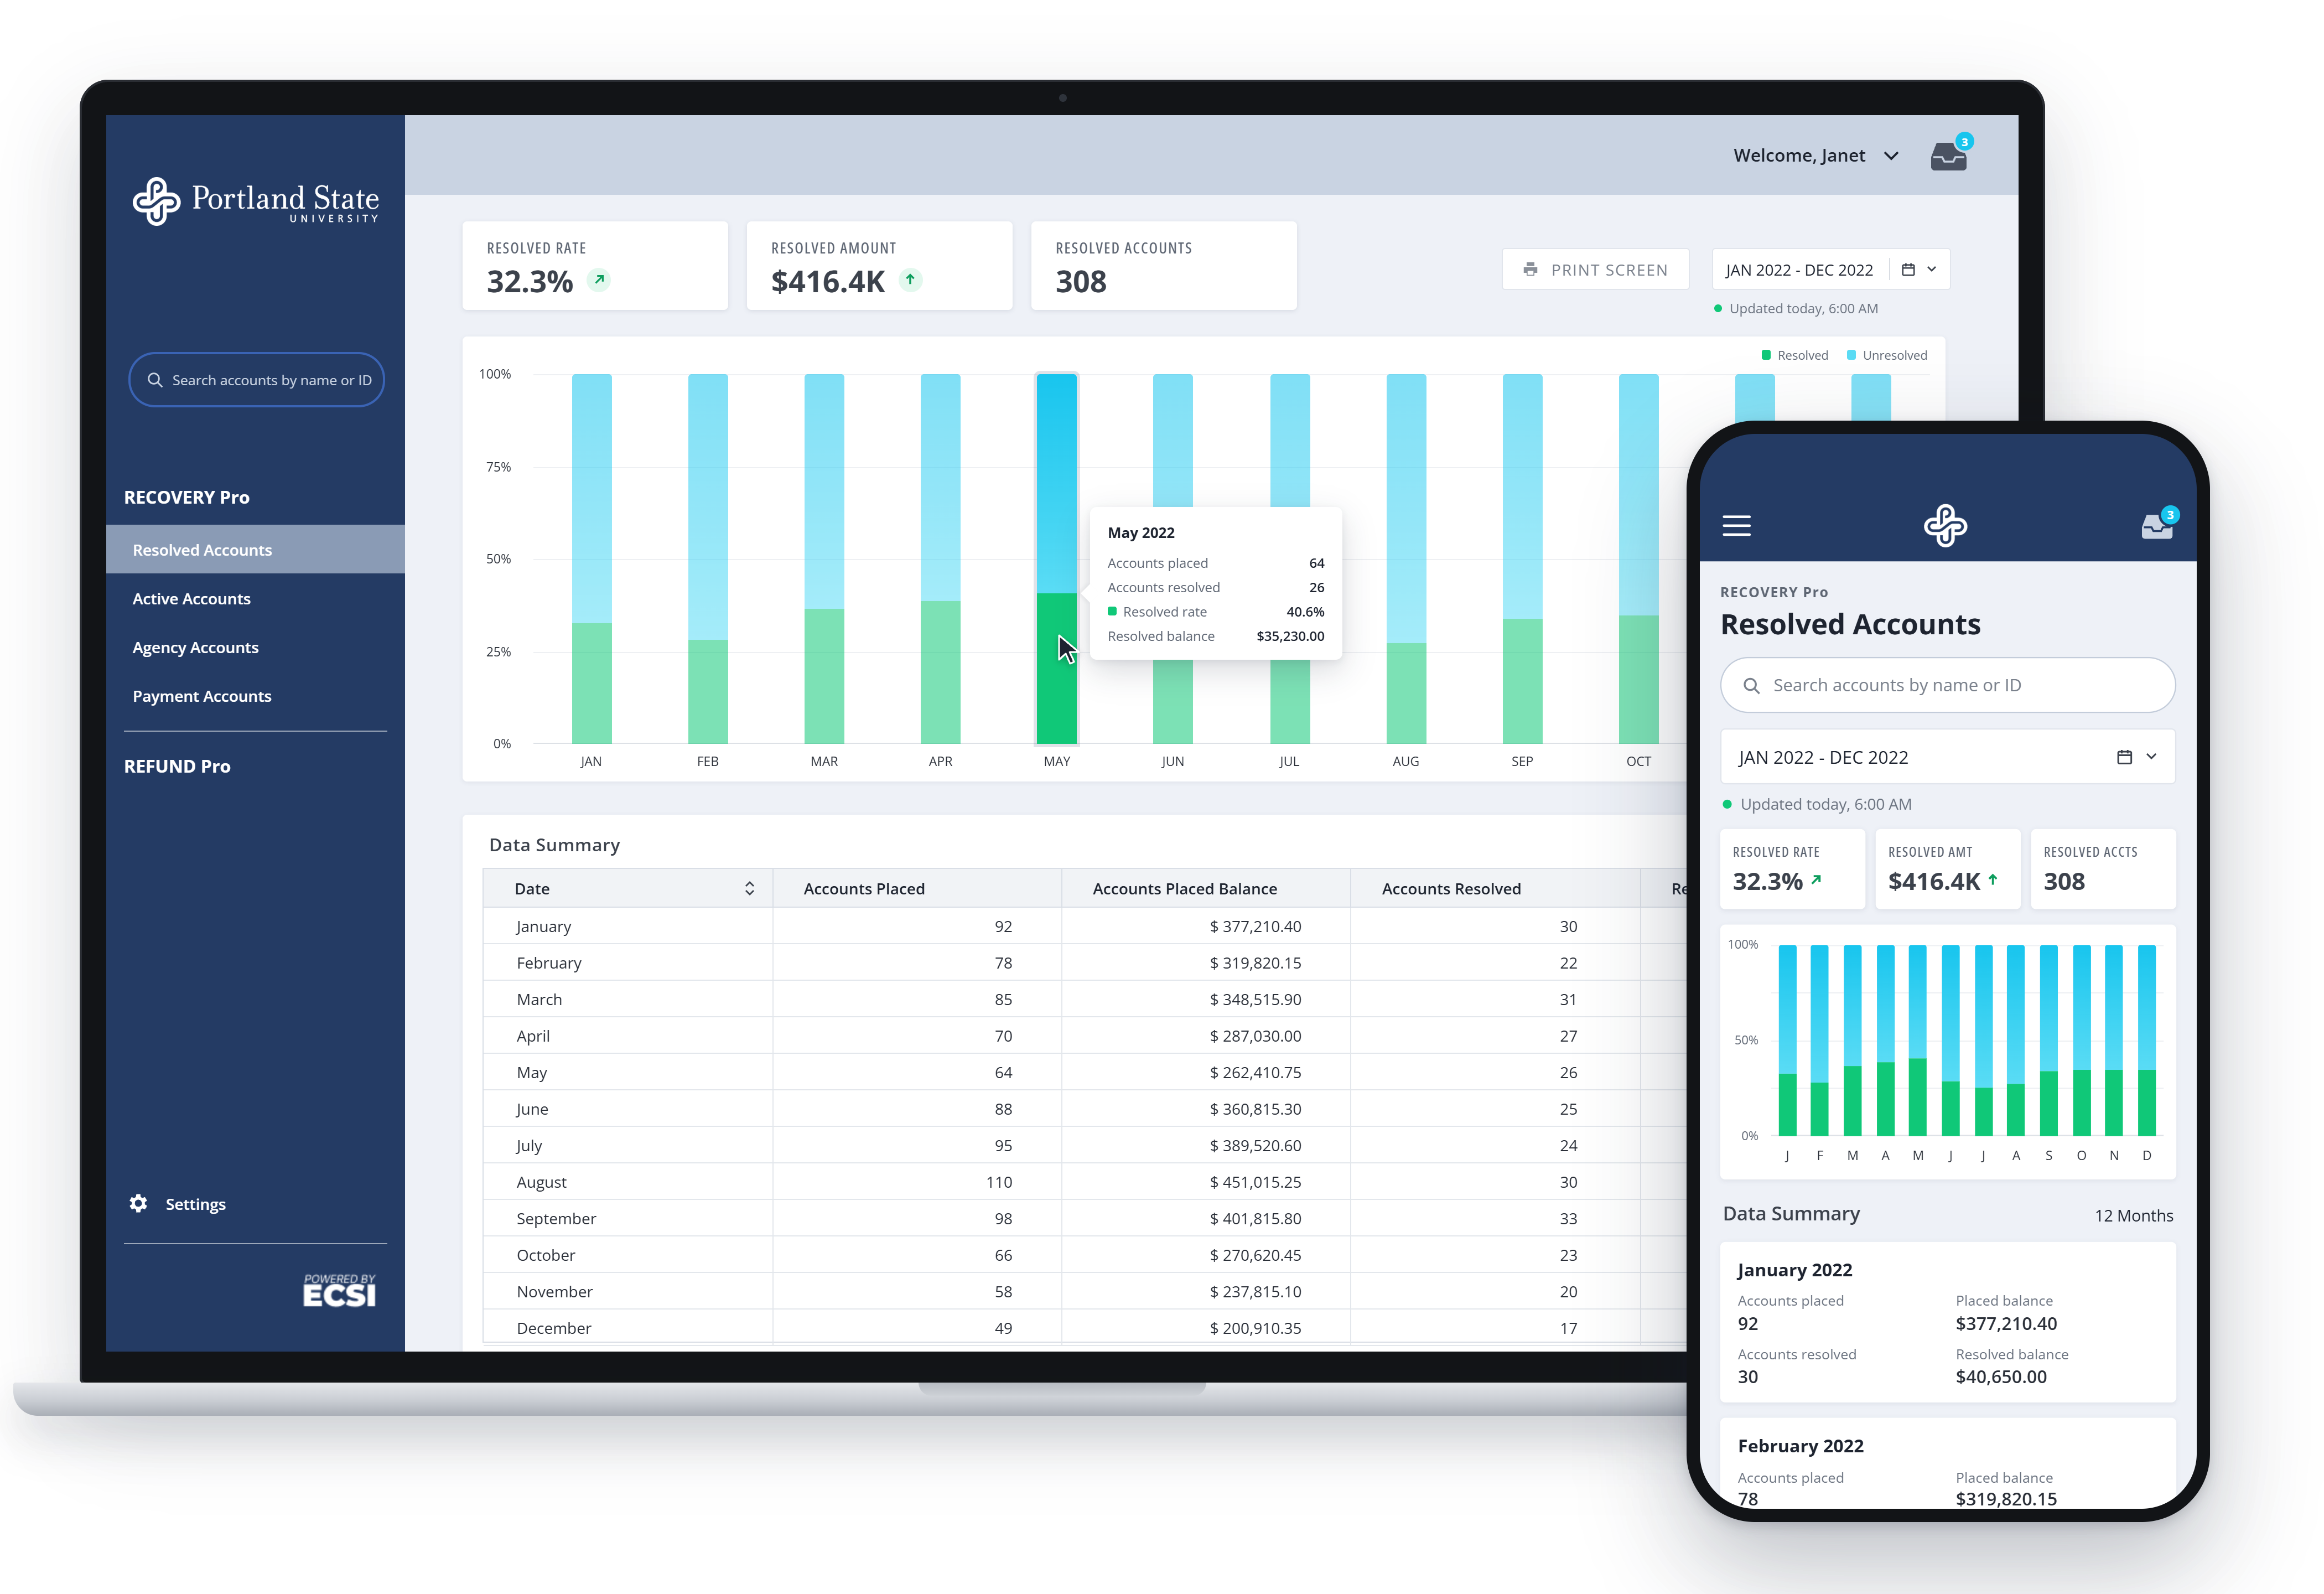
- Survey completion rate
- 89%Survey completion rate
- Reduction in data errors
- 97%Reduction in data errors
- Faster data availability
- 95%Faster data availability
Context
The NIH-funded study followed families across rural Appalachia. When I joined a few months in, it was losing participants faster than it could replace them, and its funding depended on the data those families provided.
Every survey was a paper bubble sheet. The sheets traveled between sites for a week or more before someone typed them into the database by hand, picking up errors along the way. The questions were dense and academic, more than 120 of them, written for researchers rather than the families answering them. Many participants read with difficulty, knew little medical vocabulary, and had good reason to be wary of institutions.
My role: UX designer and researcher. I led design from field research through in-clinic testing over an eight-week engagement, with updates through the following year. I worked with research teams at Pitt and WVU, clinicians, developers, and community partners.
Objective
Reliable data came first. On the paper sheets, one pattern kept appearing: whole columns of identical answers, filled in by people who wanted to be done. Those surveys were complete, and the study couldn’t use them.
Participants needed questions they could follow by ear and answer without reading or writing. They also needed their exam visit to run on time. Clinicians needed accurate records without losing hours to paperwork. All of it had to work in rural clinics with:
- Limited literacy. Nothing could rely on reading or writing.
- Unreliable internet. The tablets had to work offline and sync later.
- Thin trust. A participant who had a bad visit might not come back.
The original work
1. Turning 120+ questions into speech
I worked through the survey item by item with the research team. I handled the wording and the interaction, and the researchers made sure each rewrite still measured what the original was validated to measure.
| Original | Rewrite | Grade level |
|---|---|---|
| “Is there any known consanguinity?” | “Are the child’s parents related by blood?” | 11 → 4 |
| “Most people do not realize the extent to which their illnesses are controlled by accidental happenings.” | “Getting sick is mostly by chance, not something you control.” | 9 → 5 |
| “I know someone I would feel perfectly comfortable talking to about problems budgeting my time between school and my social life.” | “When it’s hard to keep up with both school and friends, I have someone to talk to.” | 9 → 2 |
Scored with the Flesch-Kincaid Grade Level formula.
Most of the effort went into protecting each question’s meaning while the words got simpler. The rewrites were recorded as audio prompts and loaded onto tablets, which ran offline and uploaded to a shared database at the end of each clinic day.
2. Watching the clinic day
I spent time in the clinic watching visits unfold from arrival to exam. Two problems had nothing to do with the survey:
- Onboarding. Clinicians spent about 15 minutes with each household, collecting names and drawing three-generation pedigrees by hand.
- The exam queue. Emergencies took priority, as they should, and families with routine exams waited for hours.
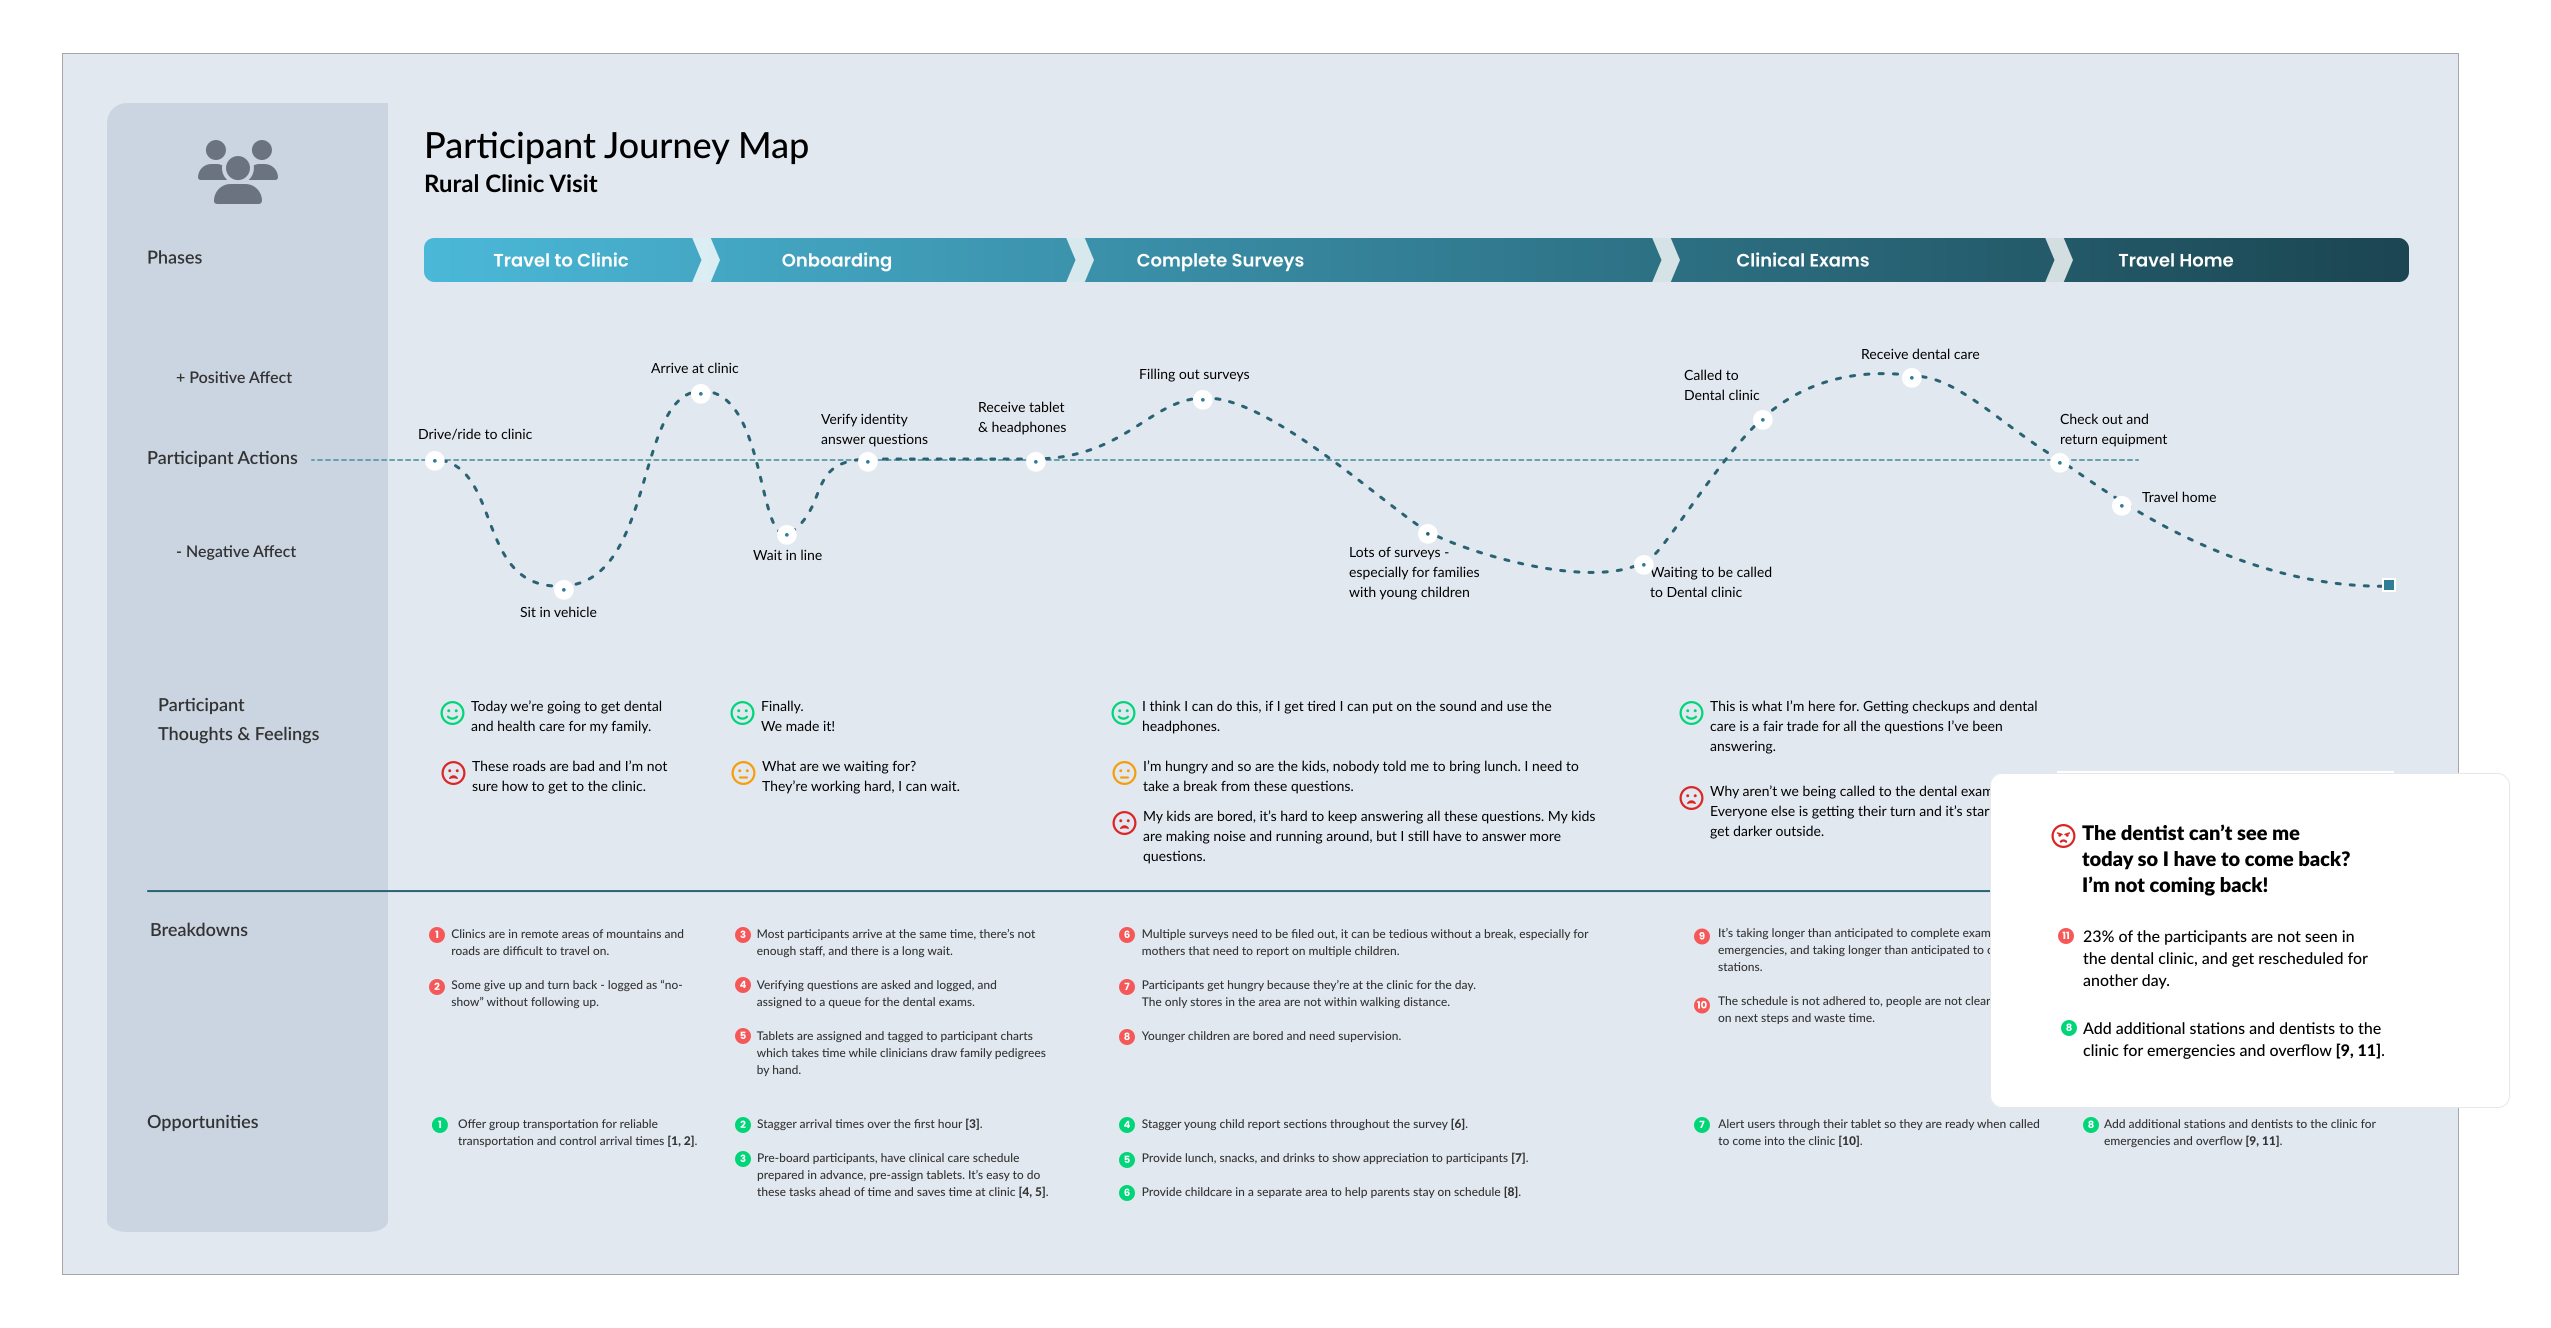
I then mapped the full service, from the participant’s path to staff workflows and the handoffs between them, to see how the two problems were connected.
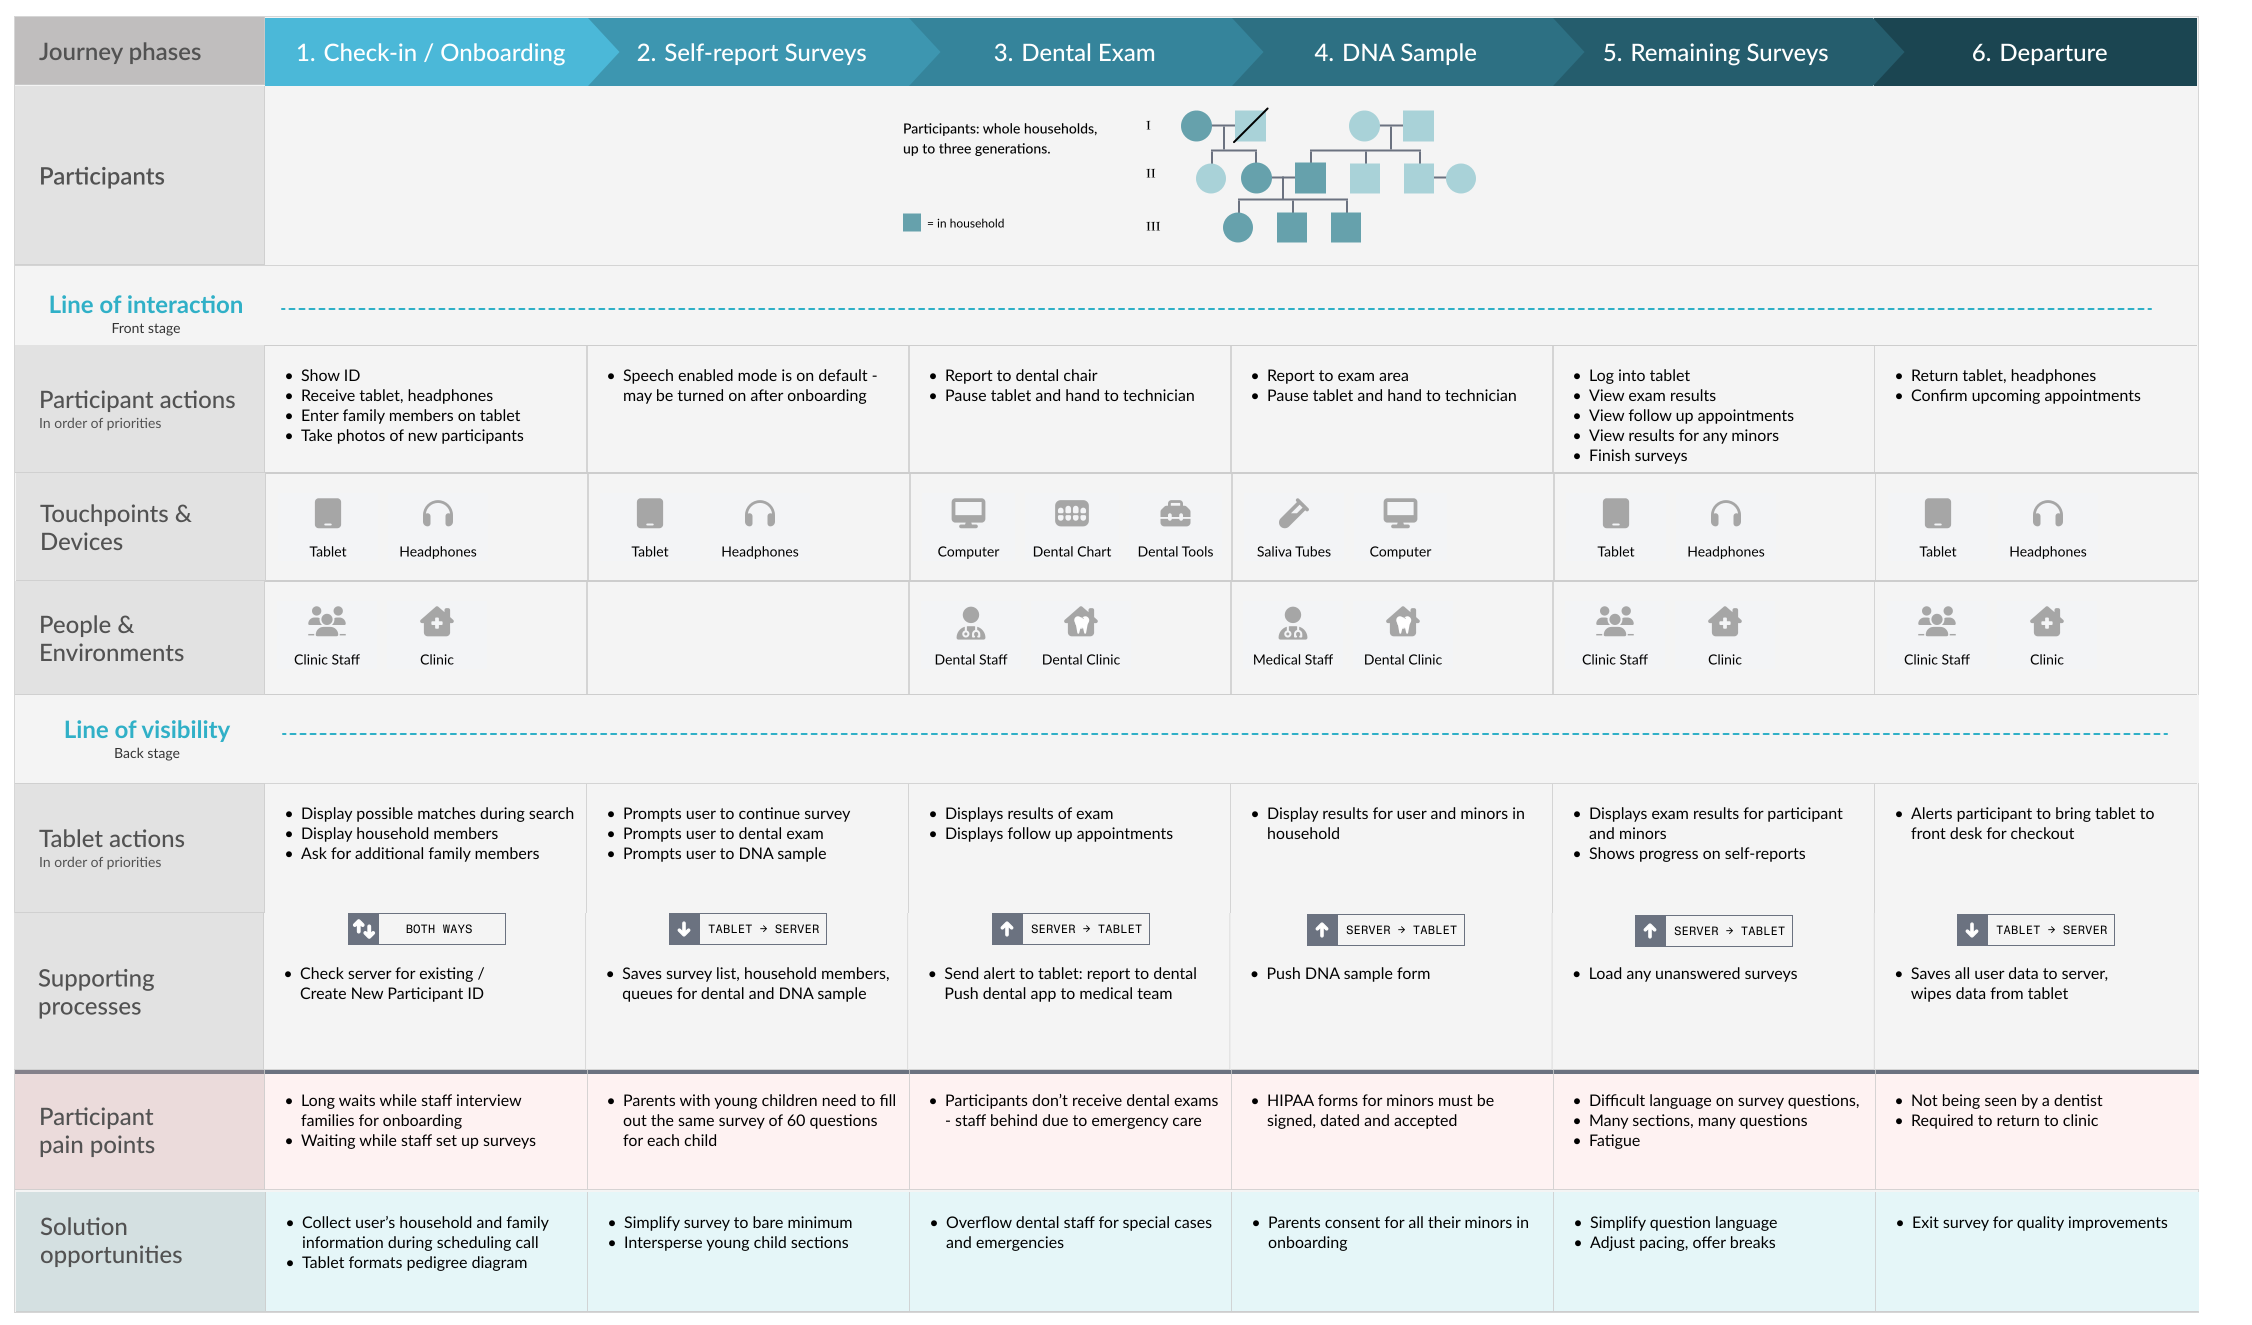
3. Family pedigrees in a minute
The study needed a pedigree for every household, mapping the people living there and their extended family. Clinicians drew each one by hand at check-in, and with most families arriving at once, everyone else waited. On the tablet, participants confirmed the family members already listed, added anyone missing, and the system drew the pedigree. Onboarding went from 15 minutes per household to 1, and clinicians got that time back for checking families in.
4. Clearing the exam backlog
When someone arrived with an emergency, such as an infection, clinicians treated them first. The families behind them waited, sometimes for hours, and some went home without an exam.
A screen couldn’t solve this, and staffing belonged to the directors. I brought it to them in the study’s terms: each family that left was a participant, and a set of data, the study might not get back. We agreed to add an overflow dental team for emergencies. Urgent cases still got care, and scheduled exams started on time.
Key decisions and trade-offs
| Decision | Why | Result |
|---|---|---|
| Rewrite every question in plain spoken language; participants listen and tap | Many participants read with difficulty, and the paper sheets came back straightlined | Reading level fell from grades 9–11 to 2–5, and 89% of tablet surveys were completed, with researchers confirming each rewrite still measured what the original did |
| Study the whole clinic day, not just the survey | The tablets were in use, but participation was still being lost somewhere | Surfaced two problems outside the survey: 15-minute onboarding and the exam queue |
| Participants pick household members from a list and the system draws the pedigree | Clinicians were drawing three-generation pedigrees by hand | Onboarding went from 15 minutes per household to 1 |
| Take the emergency staffing problem to the study’s directors, outside my scope | No screen could stop families leaving without an exam | An overflow dental team was added; urgent cases still came first and scheduled exams started on time |
Outcomes
Participants finished 89% of the tablet surveys, and data errors fell by 97%. The study recovered enough participation and data quality to keep its NIH funding.
| Metric | Result | How it was measured |
|---|---|---|
| Survey completion rate | 89% | Tablet surveys completed vs. paper surveys, where participants straightlined |
| Reduction in data errors | 97% | Tablet entries vs. paper surveys keyed in by hand |
| Faster onboarding per household | 15× | 15 minutes down to 1 minute |
| Faster data availability | 95% | 8 hours to reach all institutions, down from a week or more |
Once an overflow team took on emergencies, the exam queue kept moving and every participant was seen.
What I learned
Map the whole service before designing screens.
The blueprint came after I’d already seen the problems in the clinic. It explained them, but drawn earlier, it would have found them sooner. Now I map the whole service first, and that habit shaped the rebuild.
The rebuild: the survey and the clinic as one system
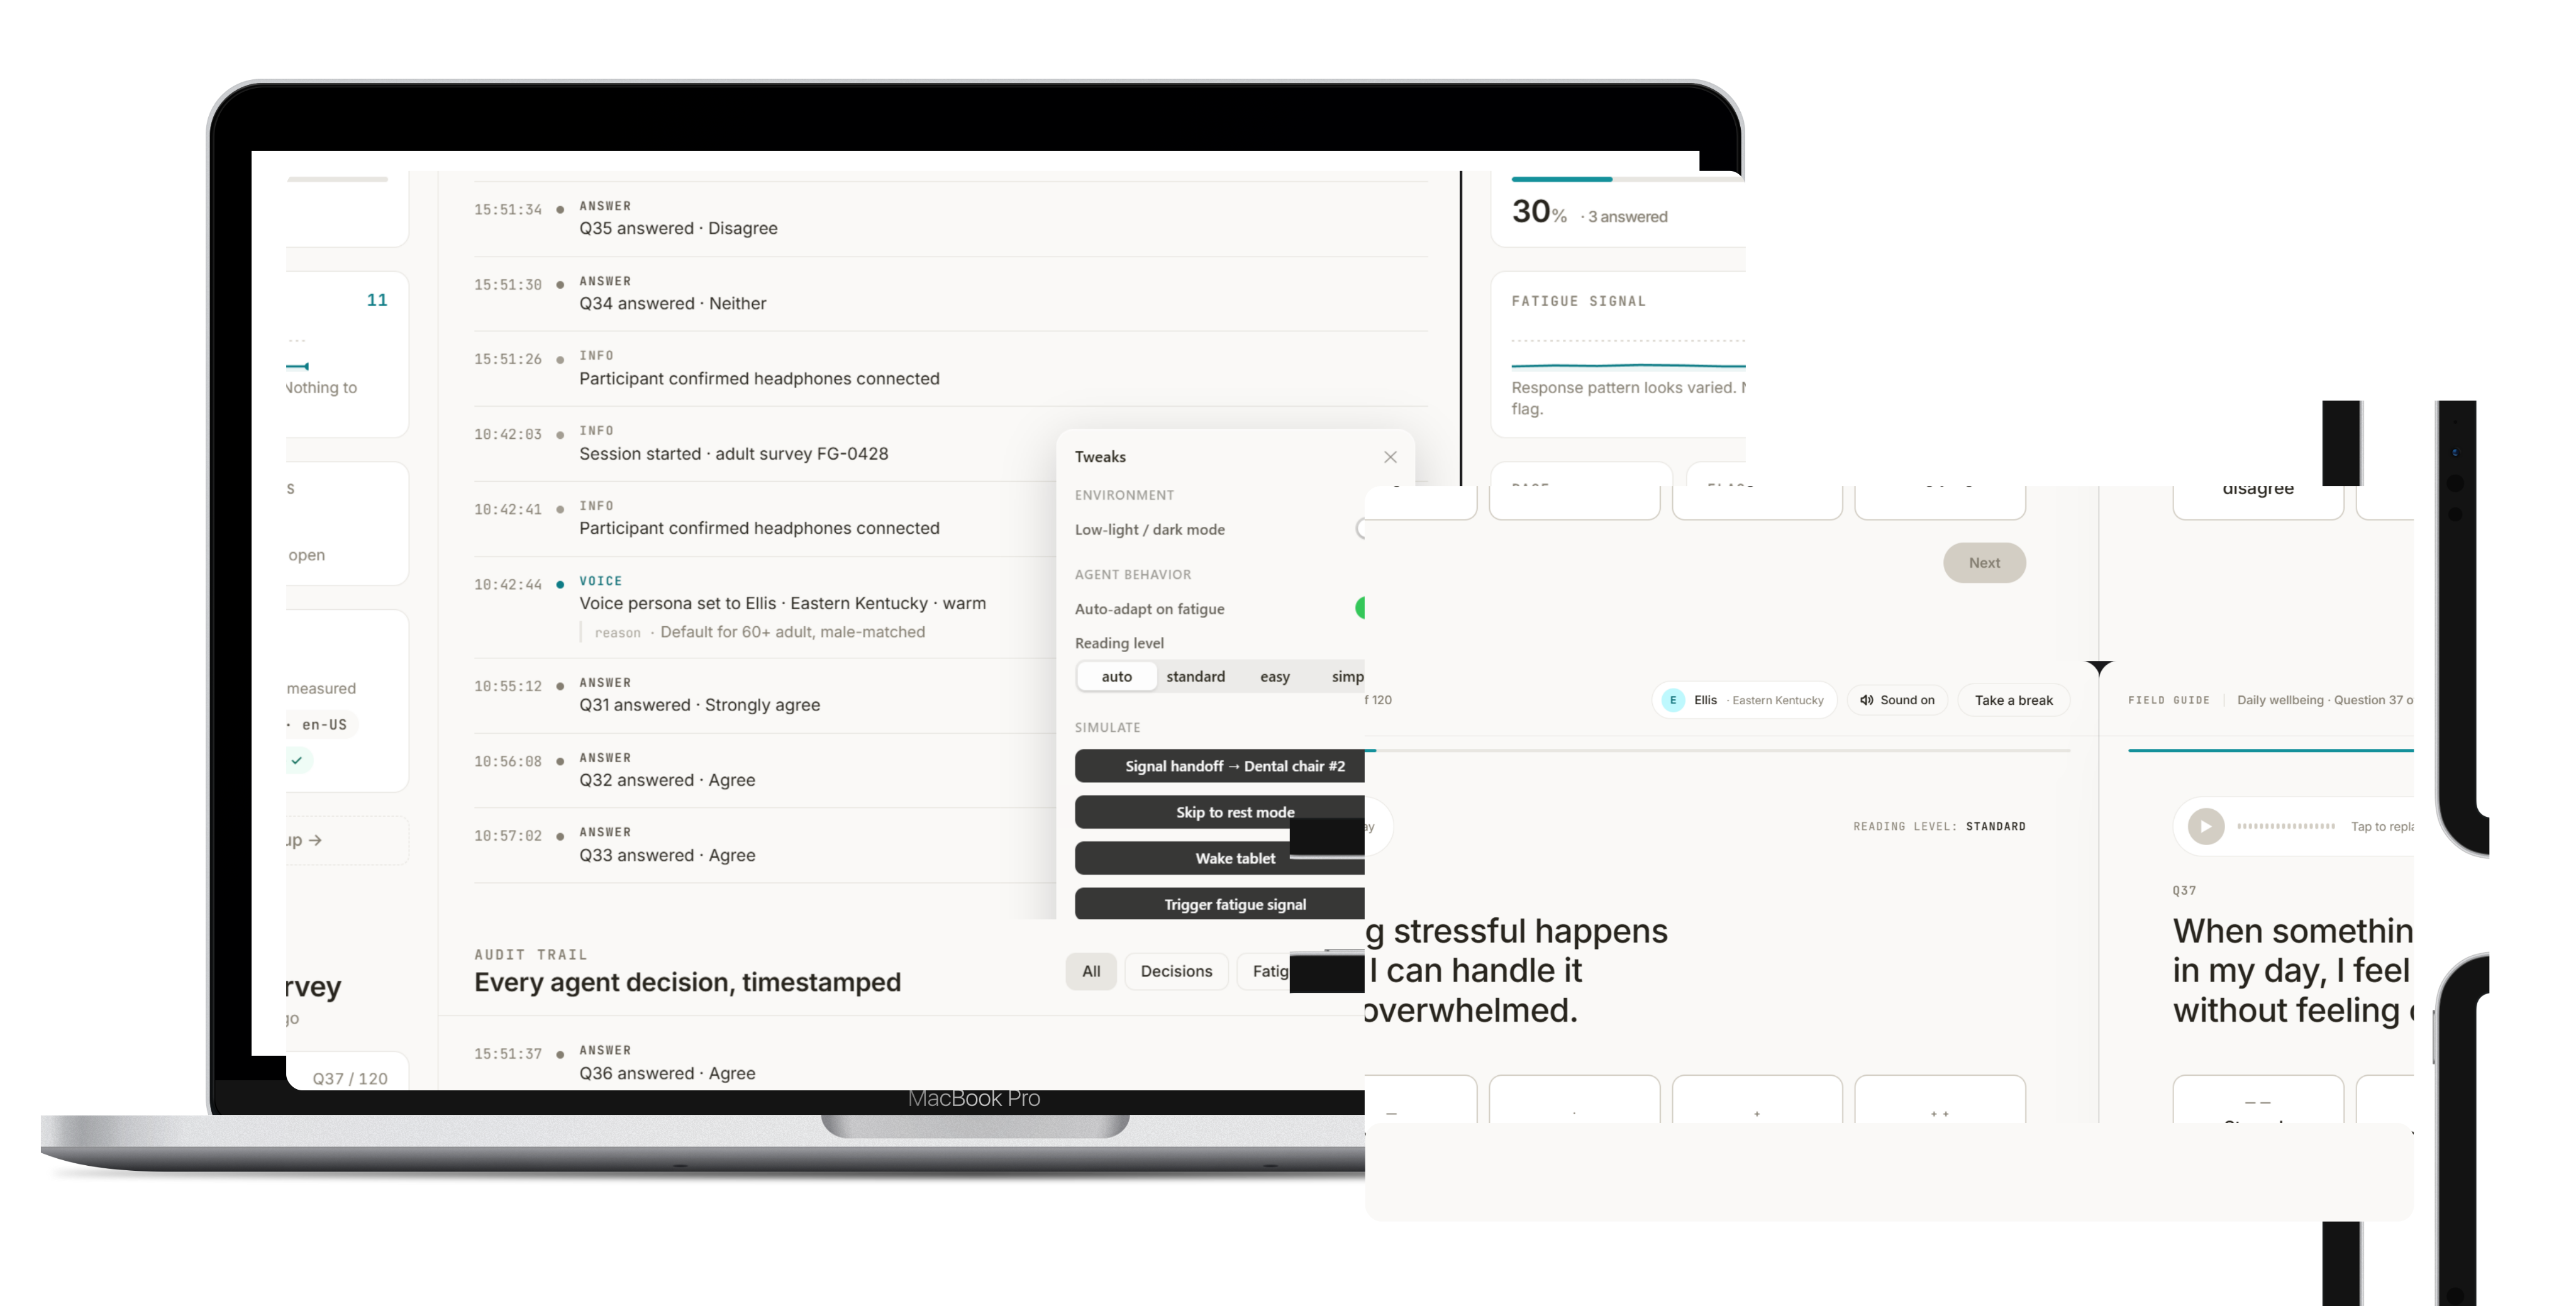
The first version solved them separately, with tablets for the survey and a new team for emergencies. In the rebuild, the participant’s tablet and the clinic’s dashboard share the same data, so staff can see the day as it happens.
My role: I designed and coded the rebuild in React and Next.js. The ElevenLabs API generates each question’s audio ahead of time so the tablets work offline. The Anthropic API drafts plain-language versions of questions for researchers to review.
Design principle: All AI work happens before clinic day. Nothing at the clinic needs an internet connection.
When a question doesn’t land
If a participant replays a question twice, the tablet offers a simpler version. Each validated question measures one specific thing, and loose rewording can change what it measures without anyone noticing. A model drafts the alternatives, and researchers approve each one before it goes on a tablet.
After a few questions, the tablet calls the participant to the dental chair. When they come back, the survey resumes where they stopped. People answer questions during time they would otherwise spend waiting.
When someone gets tired
The tablet compares how long each answer takes against that person’s own pace, and counts replays. It also watches for the old paper problem: answers tapped before the question finishes, or the same answer chosen again and again. When those signs appear, the tablet offers a break or a simpler version, and flags the dashboard so staff can check in. Rules run offline, and researchers can see exactly why a flag was raised.
Researcher · fatigue detection
Answer time, question by question
- Pace
- 6s
- Slowest
- 14s
- Flags
- 1
- Seconds to answer
- Personal pace band
- Check-in offered
- Replay
Seeing the clinic day at a glance
- Today’s participants, with details for each person
- Exams completed, pending, and in the queue
- Who is taking surveys, and how far along they are
- Where staff are: dental lab, survey area, or front desk
- Fatigue flags and help requests
The lead can spot a growing queue early and move staff before families start leaving.
See it working
To supply
Live demo: Vercel link or embed
The demo follows one participant from the first question to the dental chair and back, including a replay, a simpler version, and a fatigue check-in. The clinic dashboard updates alongside it.
Closing
On paper, participants answered questions they couldn’t read, and the study couldn’t trust the answers. The original tablet and the rebuild both start from the same idea: research about a community only works when that community can take part in it.